What is a Proportional Relationship?
- Proportional Relationships – Definition
- Proportional Relationships in Tables
- Understanding Direct Proportionality
- Inverse Proportional Relationships


Basics on the topic What is a Proportional Relationship?
Proportional Relationships – Definition
In everyday life, we often encounter situations where understanding the relationship between different quantities is essential, such as when mixing ingredients for a recipe or determining the speed needed to travel a certain distance in a given time. This is where the concept of a proportional relationship becomes crucial, helping us make sense of these everyday scenarios logically and mathematically.
A proportional relationship is a relationship between two variables where their ratios or rates remain constant. This means that as one quantity increases or decreases, the other does so in a directly proportional manner.
Proportional relationships are all about maintaining a consistent ratio which can be represented in the following forms:
- table
- graph
- equation
Proportional Relationships in Tables
A proportional relationship requires a constant ratio between the two quantities. In this table, for each additional day, the money saved increases by $\$$5. This consistent increase indicates a fixed ratio.

This table shows that for each day, the amount of money saved increases by $\$$5, maintaining a consistent ratio of 1 day to $\$$5.
Understanding Direct Proportionality
Direct Proportionality: The table shows that the days and the amount of money saved are directly proportional. As the number of days increases, the total amount of money saved increases in a directly proportional manner.
Check how well you already understand direct proportionality with some exercises:
| x | y |
|---|---|
| 1 | 3 |
| 2 | 6 |
| 3 | 9 |
| x | y |
|---|---|
| 1 | 4 |
| 2 | 7 |
| 3 | 11 |
Identifying proportional relationships in tables helps you better understand and interpret data, a key skill in both math and everyday life.
Inverse Proportional Relationships
Inverse proportional relationships occur in many real-world scenarios, offering a different perspective on how quantities relate to each other compared to direct proportionality.
In an inverse proportional relationship, two variables behave in a way that when one increases, the other decreases proportionally, such that their product is always constant. This relationship is represented by the formula $y = \frac{k}{x}$, where $k$ is a constant.
Consider a scenario involving the brightness of a projector screen as you move further away.
- Closer Distance: When you are $2$ meters away from the screen, the brightness is at a certain level.
- Increasing Distance: As you move further away, say to $4$ meters, the brightness decreases.
- Relationship: If the brightness at $2$ meters is $B$, at 4 meters it would be $\frac{B}{2}$.
In this case, the brightness of the screen is inversely proportional to the distance from it. The further you move away, the less bright the screen appears. The product of the distance and brightness remains constant, illustrating an inverse proportional relationship.
Proportional Relationships in Graphs
Imagine a scenario where you save $5 every day. The graph of your savings over time would show a straight line, where the horizontal axis represents the days and the vertical axis represents the amount of money saved.

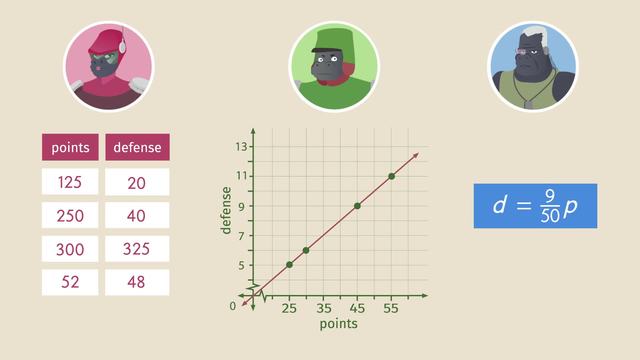
In a graph depicting a proportional relationship, the key feature is a straight line that intersects the origin. This line is a visual interpretation of the equation $y = kx$, where $k$ stands for the constant of proportionality. It demonstrates that every value of $y$ is directly determined by multiplying the corresponding $x$ value by the constant factor $k$, thus showcasing a precise proportional relationship between the two variables.
Let’s apply your knowledge of proportional relationships in graphs to practice now.


Interpreting graphs of proportional relationships will also help you better understand the importance of the slope intercept form.
Proportional Relationships in Equations
An equation represents a proportional relationship if it can be expressed in the form $y = kx$, where $k$ is a constant.

The relationship between the days and the amount of money saved can be described by the equation $y = 5x$, where $y$ is the total amount of money saved, and $x$ is the number of days. This equation shows that the amount saved is directly proportional to the number of days.
Representing proportional relationships with equations is a method that will directly lead to understanding what the slope of a line is.
Proportional Relationships – Real-World Problems
Let's work through some examples of real-world problems and determine whether there are proportional relationships.
| Hours (h) | Distance (km) |
|---|---|
| 1 | 60 |
| 2 | 120 |
| 3 | 180 |

| Days (d) | Water in Liters (L) |
|---|---|
| 1 | 2 |
| 2 | 4 |
| 3 | 6 |

Proportional Relationships – Summary
Key Learnings from this Text:
- A proportional relationship maintains a constant ratio between two quantities.
- In tables, this is seen as a constant ratio across rows.
- In graphs, proportional relationships are represented by straight lines through the origin.
- In equations, they follow the form $y = kx$, where $k$ is a constant.
Proportional Relationships – Frequently Asked Questions
Transcript What is a Proportional Relationship?
[Embark on an extraordinary journey as the world's most perfect smoothie is unveiled, captivating all who taste its flawless perfection! Sadly, the serving size is only for one. To discover the secret to recreating this smoothie for the world to enjoy, we will need to ask the question, What is a Proportional Relationship? A proportional relationship exists when two variables vary directly with each other. When we analyze the relationship between variables in a table, we determine if the ratios are equivalent. If they are all equivalent, then the relationship is proportional. If you notice in the table, the ratio from x to y is one-fifth in the top row. The second row is two-tenths, which is equivalent to one-fifth. As you can see, all of the remaining ratios are also equal to one-fifth. If we looked at it in reverse and compared the y to x ratio, the ratios will still be equivalent! All of the ratios are equivalent to five, so this relationship is proportional. If we had this information as a graph, there are two features we need to look at to determine if it's proportional. The line must pass through the origin, and it must be a perfectly straight line to be a proportional relationship. A non-proportional relationship in table form, would yield ratios that are not all equivalent to each other. Whether we compare the x to y as a ratio, or the reverse y to x, this is a non-proportional relationship. Take a look at what a non-proportional relationship looks like when graphed. Our line does not go through the origin and it is not straight. Even if one of these conditions isn't true, then the relationship is non-proportional. Okay, now that we have these tools, let's get back to those smoothies. Let's look closely at the ratios in the table, to examine the relationship between the number of servings, and cups of yogurt. For one serving it would be two cups of yogurt per serving. For two servings, it would also be two cups of yogurt per serving. But it is different at five servings! The ratio is not equivalent because it would be three cups of yogurt per serving, which will definitely impact the taste. This table is non-proportional because the ratios are not all equivalent. For the next smoothie ingredient, let's look at the relationship between servings and ice cubes used and determine if it's proportional. The line is straight, which is one of the two conditions that a proportional relationship must meet. However, because this line does not pass through the origin, this relationship is non-proportional. The next smoothie ingredient is bananas. Each of these ratios is equivalent to one, so this is in fact a proportional relationship. The last ingredient in the smoothie is drops of spicy habanero sauce. Let's examine the relationship shown. This graph shows a proportional relationship since the line passes through the origin, and it is perfectly straight. Now that we know about those smoothie ingredients, let's summarize what we learned! A relationship is considered proportional if all its ratios are equivalent, and it can create a straight line that passes through the origin. Unlock the realm of perfection with our meticulously equivalent ingredients, crafting the world's most proportional smoothie.
What is a Proportional Relationship? exercise
-
What are the conditions?
HintsHere is an example of a proportional relationship with fruit juice.
$2$ litres fruit juice = $1$ litre orange and $1$ litre pineapple
$4$ litres = $2$ orange and $2$ pineapple.
If a relationship is proportional it will always pass through the origin ($0$, $0$) because if you have no ingredients then you have no juice.
The more ingredients you have, the more juice you can make.
This is a graph of a proportional relationship.
- The line passes through the origin ($0, 0$)
- All the ratios are equivalent (as $x$ rises $y$ rises, by the same proportion, thus forming a straight line).
SolutionThe ratios are equivalent.
A straight line that passes through the origin ($0$, $0$).
These are the two conditions which make a relationship proportional.
A way to think of this is a recipe.
No ingredients = no food.
The more ingredients the more food can be made.
Also, to keep the taste the same the ingredients have to be equivalent every time we increase the size of the recipe.
-
Which graphs show a proportional relationship?
HintsThere are two conditions of a relationship being proportional.
- All ratios are equivalent - that means they go up by the same gradient in a graph.
- They form a straight line that passes through the origin $(0,0)$.
We are looking for a straight line that goes through the origin.
For example:
SolutionThese two graphs show a proportional relationship as they go through the origin, in a straight line and the ratios are equivalent.
-
We are making strawberry ice cream!
HintsA relationship is proportional if the ratios are equivalent.
For example:
- $1$ and $4$ would have the relationship $\frac{1}{4}$.
- Likewise, $2$ and $8$ would have the relationship $\frac{2}{8}$ = $\frac{1}{4}$.
An example of a relationship that is not proportional is when the ratios are NOT equivalent.
For example:
- $1$ and $5$ would have the relationship $\frac{1}{5}$.
- $2$ and $12$ would have the relationship $\frac{1}{6}$ so, is not proportional.
SolutionThis is the correct answer as all the ratios are equivalent.
- $1$ and $5$ would have the relationship $\frac{1}{5}$
- $2$ and $10$ would have the relationship $\frac{2}{10}$ = $\frac{1}{5}$
- $3$ and $15$ would have the relationship $\frac{3}{15}$ = $\frac{1}{5}$
- $4$ and $20$ would have the relationship $\frac{4}{20}$ = $\frac{1}{5}$.
-
Apply your knowledge of proportional reasoning to find missing measurements.
HintsPies to eggs
- $1$ pie needs $15$ eggs = $\frac{1}{15}$ or $\frac{15}{1}$ = $15$ eggs.
- $1$ pie needs $2$ lemons = $\frac{1}{2}$ or $\frac{2}{1}$ = $2$ lemons.
To get eggs we do pies$\times$15
$10$ pies = $10$ x $15$ = $150$ eggs.
Do the same for lemons.
pies$\times$2 = number of lemons.
Solution- $2$ pies needs $30$ eggs and $4$ lemons
- $4$ pies needs $60$ eggs and $8$ lemons
- $5$ pies needs $75$ eggs and $10$ lemons
- $20$ pies needs $300$ eggs and $40$ lemons
We multiply the number of pies by $15$ to get the eggs and multiply the number of pies by $2$ to get the lemons.
-
Use a proportional relationship to solve a problem.
HintsThis is a proportional relationship so, we need the correct proportion of chocolate for the number of brownies.
$1$ tray uses $500$ grams.
This means the ratio is $\frac{1}{500}$ or $\frac{500}{1}$ = $500$ grams per tray.
It may help to start with $1$ then $2$ trays, etc.
For example:
$1$ tray uses $500$ grams
$2$ trays use $2$ x $500$ = $1,000$ grams.
Continue with this until you reach $4$ trays.
Solution$4$ trays use $2,000$ grams of chocolate.
-
Determine the proportional relationship.
HintsIn order to make $5$ kg of concrete we need
- $3$ kg of sand
- $2$ kg of cement
For example:
- We have $29$ kg of sand, when we need $3$ kg for each.
- We do $29$ $\div$ $3$ = $9$ lots remainder $2$.
When you have worked out how many lots of sand and cement you have, the maximum concrete you can make will be the smallest number.
When you have worked out the smallest number, you need to multiply this by $5$ as each lot has $3$ kg of sand and $2$ kg of cement in it.
For example, if you think the answer is $10$ lots, then the total concrete would be $10$ x $5$ = $50$ kg of concrete.
Solution$35$ kg
- We have $29$ kg of sand, $29$ $\div$ $3$ = $9$ lots plus remainder $2$.
- We have $15$ kg of cement, $15$ $\div$ $2$ = $7.5$ lots.
We have to take the smallest = $7$ lots
As there are $5$ parts in total we multiply by $5$.
Total concrete = $7$ x $5$ = $35$ kg.

From Ratios to Rates and Rates to Ratios
Finding Rates with Division
Comparison Shopping: Unit Price and Related Measurements

Getting the Job Done—Speed
Getting the Job Done—Work
Getting the Job Done: Converting Units of Measurement

Problem Solving Using Rates, Unit Rates, and Conversions
What is a Proportional Relationship?


