Identifying Proportional Relationships in Tables


Basics on the topic Identifying Proportional Relationships in Tables
After this lesson you will be able to identify proportional relationships in tables.
The lesson begins with a table representing two quantities. It leads to recalling the definition of a proportional relationship. It concludes with determining whether a table represents a proportional relationship by simplifying ratios.
Learn about proportional relationships by helping the bees collect their pollen by figuring out how to beat the wind!
This video includes key concepts, notation, and vocabulary such as: proportional relationships (a constant ratio, or the unit rate); ratio (a comparative, proportional relationship between two amounts); and ratio tables (a table of equivalent ratios).
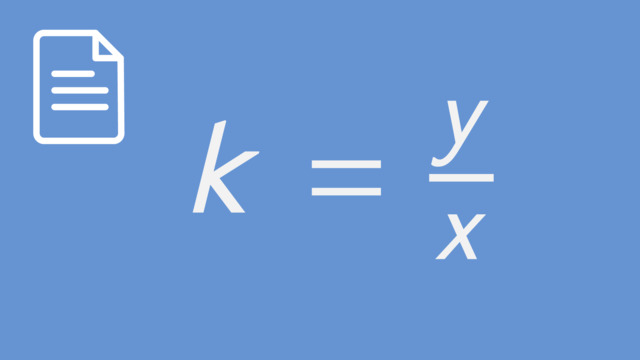
Before watching this video, you should already be familiar with the definition of a proportional relationship and the equation y=kx.
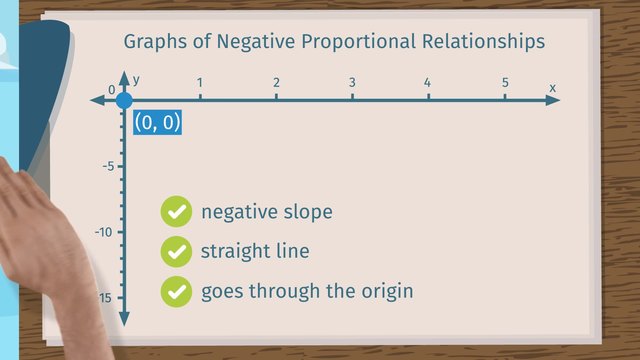
After watching this video, you will be prepared to learn whether two quantities are proportional to each other by graphing on a coordinate plane.
Common Core Standard(s) in focus: 7.RP.2.a A video intended for math students in the 7th grade Recommended for students who are 12-13 years
Transcript Identifying Proportional Relationships in Tables
Two bees are hightailing it out of their hive. Their queen just ordered them to produce more honey, but in order to do this, they need to figure out how to collect more pollen. They notice that all the pollen is being quickly blown away by the wind! They need to figure out a way to beat the wind, and collect all that pollen. Let's help the bees figure out how to collect pollen by identifying and using proportional relationships. In a table, we keep track of how many pounds of pollen get blown away when the wind is moving at certain speeds, in miles per hour. When the wind is moving at 10 miles per hour, 4 pounds of pollen is lost. At 20 miles per hour, 8 pounds is lost. At 30 miles per hour, 12 pounds. At 40, 16. At 50, 20. And at 60, 24. We want to know if there is a proportional relationship between the wind speed and the amount of pollen blown away. Such a relationship would allow us to determine how much pollen is lost based on the wind speeds throughout the day. Remember, two quantities, 'x' and 'y', have a proportional relationship if one of them is a constant multiple of the other.
In other words, the ratio of one quantity over the other is always equal to the same constant. So, to determine if there is a proportional relationship between wind speed and pound of pollen lost, we need to determine if the ratio of wind speed to pound of pollen lost is always equal to the same constant. First, let's write the ratio of wind speed to pollen in a new column in our table. Notice that the numerator is the wind speed and that the denominator is the pounds of pollen lost. Factoring out 10 and 4, and cancelling out common factors gives us 5 over 2. Factoring out 20 and 8, and cancelling out common factors also gives us 5 over 2. In fact, every ratio of wind speed to pounds of pollen lost simplifies to 5 over 2, meaning that the wind speed is proportional to the amount of pollen blown away. So, we know how much pollen will blow away given the wind speed, but how can we catch the pollen before it's gone with the wind? Using their smartcomb, the bees search for a solution for their problem. What's this? A pop-up ad for spider webs? One of the bees has a brilliant idea to buy a giant spider web to catch the pollen when the wind speeds are the strongest. To decide when to use the spider web, they study the weather report carefully, collecting data about the wind speeds at various times during the day. We can use the data they collected in this table showing the wind speed at certain hours in the day to determine if this relationship is proportional. Let's check by writing down the ratio of hour to wind speed and then simplify to see if the ratios are the same.
And 6 over 60 simplifies to 1 tenth. We can already see from the first two entries that the ratios are not always the same. Indeed, there is NOT a proportional relationship between the quantities. So the bees cannot predict the wind speed based on the hour of the day. The bees decide they just should set up the spider web 24-7 to collect the pollen. Let's take a moment and review what we learned about proportional relationships. To determine if a table represents a proportional relationship, write each ratio. Then simplify. If the simplified ratios are equal, then the table represents a proportional relationship. If the simplified ratios are not equal, then the table does not represent a proportional relationship. The bees are really excited to set up the giant web and see how much pollen they can collect. Oh look! The giant spider web they ordered just arrived! For sure the queen will be very pleased with their work! Um, wait a second. It looks like the bees should have read the really, really, really small print in the online ad.


Hi Danna Rouse, We apologize for this mistake and understand that this is confusing for your students, thank you for letting us know! Have you already seen this video?https://us.sofatutor.com/mathematics/videos/proportional-relationships-and-measuring-rates?topic=3182 It might be more understandable for your students.
We hope we could help you,
Best wishes from the content team.
The constant of proportionality is y=kx; therefore the relationship of the independent variable and dependent variable is always k=y/x, not the other way around. The content is cute but the error is substantial mathematically and very confusing for students who are just being introduced to linear equations. I could not use this material in my classroom.