Understanding and applying statistical models (linear, quadratic, and exponential)


Basics on the topic Understanding and applying statistical models (linear, quadratic, and exponential)
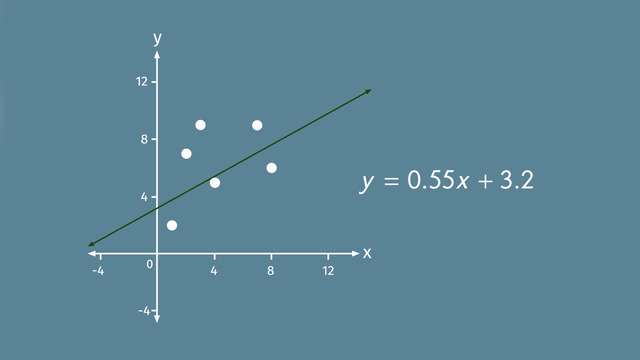
Statistical models are useful tools to assist us in representing a set of data, usually represented in visual or graphical form, approximating a general trend and allowing prediction based from this approximation. Learn more about statistical models and how they are represented by helping Phillipe Rolox decide which of his two children will inherit his watch business. Common Core Reference: CCSS.MATH.CONTENT.HSF.LE.A;3
Transcript Understanding and applying statistical models (linear, quadratic, and exponential)
Phillipe Rolox has been a watchmaker for almost 50 years. His eyesight is beginning to fail him, so he decides to leave his business to his children. Phillipe has challenged his progeny, Victoria and her brother Adrien, to improve the production speed of his beloved watches. The winner of this friendly, sibling rivalry will inherit their dad’s company. Each kid is given one watch, and then they begin their search for a new machine to win the competition. To understand which machine will produce watches the quickest, Victoria and Adrien must be able to recognize linear, quadratic, and exponential functions.
Until now, Phillipe’s production has been constant. He knows that the production can be represented by a linear function. How, you ask? Let's take a look at the table recording Phillipe's production process.
A table represents a linear function if the change in any two consecutive 'y' values divided by the change in their corresponding 'x' values is equal to the same constant value, 'm'.
The change in 'y' is often called the first difference. Let's find the first difference for this table.
1.7 minus 1.0 is 0.7.
2.4 minus 1.7 is also 0.7.
From the table, we can see that the change in any two consecutive 'y' values is always 0.7 and that the change in their corresponding 'x' values is 1.
So in this case, 'm' equals 0.7 divided by 1... which is just 0.7.
With this information, we can see that the equation representing Phillipe's production process is linear.
Victoria searched high and low and thinks she finally found a machine that promises quadratic growth! Dubious of this, Victoria writes the first 10 days' production in a table and compares the resulting number of watches. A table represents a quadratic function if the the change in 'x' is constant... and the change in the first difference is also constant. Here, the change in 'x' is always 1. The change in the first difference is often called the second difference. To find the second difference, we calculate the first difference, or change in 'y' and then we calculate the change in the first difference, or the change in 'the change in' 'y'. The change in 'x' and the second difference are constant! Victoria's production can be represented by a quadratic function, as promised.
Adrien is told by a traveling salesman that his machine can produce watches at an exponential rate. Adrien wants to make sure that the table he is shown represents an exponential function so he doesn't get hoodwinked. First, Adrien tests if the table represents a linear function. To do this, he must look at the change in 'y' over the change in 'x'. The change in 'x' is always 1 but the first difference varies: the first value is 0.4, the second value is 0.56 and the third value is 0.78. So the change in 'y' over the change in 'x' is not always equal to the same value meaning that this table does not represent a linear function. He then tests if the table represents a quadratic function. To do this, he needs to look at the second difference. The first value is 0.16 and the second value is 0.22. Those aren't the same value, so it's not a quadratic function.
Could the salesman actually be telling the truth?!?!? The table represents an exponential function if the change in 'x' is always constant and the ratio of the 'y' values is constant. Adrien can see that the change in 'x' is always one, and now has to check the ratio of the 'y' values: He divides the value at day 1 by the value at day 0, and gets 1.4. Then he divides the value at day 2 by the value at day 1 and also gets 1.4. Rounding to the nearest tenth when necessary, he continues and gets 1.4 every time. The salesman was actually telling the truth! It IS an exponential function!
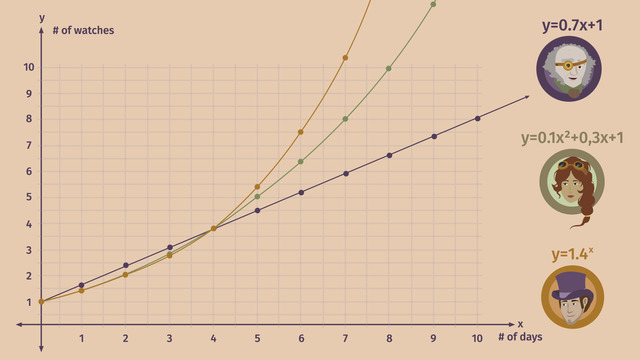
With Victoria and Adrien’s legwork done Mr. Rolox plots the production tables in a coordinate plane, so that he can really compare their production processes. Since none of the production processes are ever negative, we only need to look at the first quadrant of the coordinate plane. First, he plots the points from his production table. Because he knows that his production of watches can be represented by a linear function he draws a straight line connecting all the points he plotted. Next, he plots the points from Victoria's production table. Indeed, Mr. Rolox sees the characteristic u-shape of a quadratic function. Victoria's production of watches can be represented by a quadratic function. She HAS found a faster way to make watches! Finally, he plots the points from Adrien's production table. Mr. Rolox quickly sees that Adrien's production of watches can be represented by an exponential function, just as he said! All three production lines will produce approximately 4 watches in a similar amount of time but just look at how Adrien's exponential production line takes off after that!
Mr. Rolox is super-excited by his children’s initiative in finding faster ways to produce watches! They can produce SO many watches in so little time! Thanks to his kids, Mr. Phillipe Rolox doesn’t have to strain his eyes to make watches anymore! This is so great that he decides to work a few more years...
...too bad for his kids...I guess no one’s gonna inherit his watch shop any time soon...
Understanding and applying statistical models (linear, quadratic, and exponential) exercise
-
Construct the corresponding function.
HintsIf you put in an $x$-value into a function, the result will be its corresponding $y$-value.
If the change in $y$ over the change in $x$ is always the same, then the resulting function is linear.
SolutionLet's take a look at the table recording Phillipe's production process.
A table represents a linear function if the change in any two consecutive $y$ values divided by the change in their corresponding $x$ values is equal to the same constant value, $m$.
The change in $y$ is often called the first difference.
From the table, we can see that the change in any two consecutive $y$ values is always $0.7$, and that the change in their corresponding $x$ values is $1$.
So in this case, $m$ equals $0.7$ divided by $1$, which is just $0.7$.
With this information, we can see that the equation representing Phillipe's production process is linear.
In general, a linear function is given by an equation of the form $y=mx+b$.
Plugging in $0.7$ for $m$ in the equation, we have the function $y=0.7x+1$, which describes Phillipe's watch production process.
-
Determine the ratio of the $y$ values.
HintsCalculate the first two second differences.
A table represents a quadratic function if the second difference is constant.
SolutionFirst, let's check if this table represents a linear function. It represents a linear function if the change in $y$ over the change in $x$ is constant.
Since the difference of the $x$ values is $1$, we just need to check to see if the first difference is constant:
- $1.40-1.00=0.40$
- $1.96-1.40=0.56$
- $2.74-1.96=0.78$
If a table represents a quadratic function, then the difference of the $x$ values is $1$ and the second difference is constant. Calculating the second difference:
- $0.56-0.40=0.16$
- $0.78-0.56=0.22$
This table represents an exponential function if the difference of the $x$ values is $1$ and the ratio of the $y$ values is constant. Calculating the ratio of the $y$ values, we can see that it is always $1.4$. Thus, this table represents an exponential function.
-
Plot the points from the graph and determine if it is linear, quadratic, or exponential.
HintsFirst, calculate the points when $x=0$, $x=1$, $x=2$, and so on.
To plot a point $(x,y)$ in a coordinate plane proceed as follows:
Draw a line parallel to the $y$-axis passing through the $x$-value, and a line parallel to the $x$-axis passing through the $y$-value. The desired point is the intersection of those two lines.
Connect those points to get the desired graph. The graph of a quadratic function is a parabola.
SolutionWe are given the following table of points:
$\begin{array}{c|c|c|c|c} x&0&1&2&3\\ \hline y&0.6&2.1&4.6&8.1 \end{array}$
To plot each ordered pair $(x,y)$, draw a line parallel to the $y$-axis passing through the $x$-value, and a line parallel to the $x$-axis passing through the $y$-value. The desired point is the intersection of those two lines.
Lastly, we connect those points to get the resulting graph, which is the graph of a quadratic function.
-
Determine the corresponding function.
HintsIf the change in $x$ is 1, and the first difference is constant, then the table represents a linear function.
If the change in $x$ is 1, and the second difference is constant, then the table represents a quadratic function.
If the change in $x$ is 1, and the ratio of the $y$ values is constant, then the table represents a linear function.
SolutionWe can see that the differences in the $x$ values are all $1$.
Checking the first difference, we can see already from the first two,
- $3.8-2=1.8$, and
- $7.2-3.8=3.4$,
Perhaps it's a quadratic function. For this we have to check the second difference. We have the following first differences:
- $3.8-2=1.8$
- $7.2-3.8=3.4$
- $13.7-7.2=6.5$
- $3.4-1.8=1.6$
- $6.5-3.4=3.1$
Let's check to see if the table represents an exponential function. Since we already know that the difference of the $x$ values is 1, we just have to check that the ratio of the $y$ values is constant:
- $\frac{3.8}{2}=1.9$
- $\frac{7.2}{3.8}\approx1.9$
- $\frac{13.7}{7.2}\approx1.9$
-
Explain how to distinguish the several functions.
HintsHere you see a table for a quadratic function.
The second difference of a table representing a quadratic function is constant.
SolutionLet's go through each statement one by one:
- For a linear function, the change in $y$ is constant. This statement is false. For a linear function, the change in $y$ over the change in $x$ is constant. This subtle difference is important to remember.
- A table represents a linear function if the change in any two consecutive $y$ values divided by the change in their corresponding $x$ values is constant. This statement is true.
- A table represents a quadratic function if the the change in $x$ is constant and the change in the first difference is also constant. This statement is true.
- For quadratic functions, the change in $y$ is constant. This statement is false. For quadratic functions, the change in the change in $y$, or second difference, is constant.
- The table represents an exponential function if the change in $x$ is always constant and the ratio of the $y$ values is constant. This statement is true.
- For exponential functions, the change in the first difference is constant. This statement is false. For exponential functions, the ratio of the $y$ values is constant.
-
Determine if the table represents a linear, quadratic, or exponential function.
HintsIf the change in $y$ over the change in $x$ is constant, then the function is linear.
There is one linear function, two quadratic functions, and one exponential function.
SolutionLet's start with the first table. We can see that the change in $y$ over the change in $x$ is always $3$. And so this table represents a linear function.
The change in $y$ over the change in $x$ of the second table is not constant:
- $\frac{49-28}{1}=21$
- $\frac{28-13}{1}=15$
- $\frac{13-4}{1}=9$
- $\frac{4-1}{1}=3$
- $21-15=6$
- $15-9=6$
- $9-3=6$
The third table represents an exponential function. How can we confirm this? We can see that the difference in the $x$ values is $1$, and that the ratio of the $y$ values is constant:
- $\frac{81}{27}=3$
- $\frac{27}9=3$
- $\frac93=3$
- $\frac31=3$
- $29-19=10$
- $19-11=8$
- $11-5=6$
- $5-1=4$
- $10-8=2$
- $8-6=2$
- $6-4=2$