Standard Deviation


Basics on the topic Standard Deviation
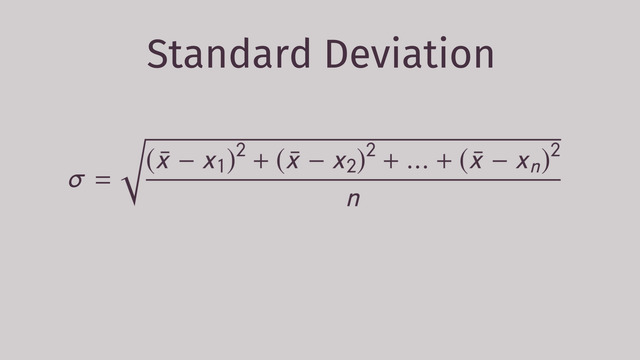
One of the statistical tools that can measure the “spread”, or variation, of a set of data is the standard deviation. It is represented by the symbol “σ” (small Greek letter Sigma). By calculating the standard deviation, we can see that a set of data is too dispersed if the standard deviation is too high. A set of data is more cohesive or consistent if the computed standard deviation is low.
The formula for standard deviation is: σ = √[ { (x - x1)2 + (x - x2)2 + …. + (x - xn)2 }/ n ]
where x is the mean of the set of data, x1 .. xn are the elements of the set of data itself, and n is the number of elements in the set of data.
From the formula we can say that the standard deviation is the square root of the averages of the squares of the difference between each element and the mean of the set.
After watching this video lesson, we can see that computing for the standard deviation is very effective especially when we need to compare different sets of data. An effective tool indeed for market research, academic thesis or dissertation and business proposals.
Summarize, represent, and interpret data on a single count or measurement variable
CCSS.MATH.CONTENT.HSS.ID.A.2
Transcript Standard Deviation
Cliff is a businessman and plans to set up his own basketball team. He loves numbers and is a really careful planner, so he hates it when things don't go as expected. Instead of a few really good players and an equal number of poor players, Cliff decides to choose players who are all consistently good. To achieve his goal of winning a championship, Cliff needs to use Standard Deviation to evaluate players' performances before he chooses his team. Cliff got the lowdown on several players from a reliable source he met in a sports bar. Cliff's contact gave him the box scores for the last 5 games for each of the players Cliff is evaluating.
The Standard Deviation
Let’s see how to calculate the Standard Deviation of the box scores of each player. The sign for Standard Deviation is called sigma, which is a lowercase Greek letter and looks like this. And the formula to calculate the Standard Deviation is: the square root of the average of the squares of the difference between each element in the set and the mean of the set.
Calculating the Standard Deviation
Now we can calculate the Standard Deviation of the scoring for the first player, Martin McTry. His scores look like this. Since there are 5 games' worth of scoring data, 'n' equals 5. Remember, you can find the mean of the set by summing all the elements of the set and dividing by the total number of elements in the set. We sum the player's scoring totals for each of the 5 games and finally divide by 5 to see that Martin McTry averaged 20 points in his last 5 games.
Now that we have the mean, we can use this to find Martin McTry's scoring standard deviation. We can just plug in n=5, as well as the mean of the set, 20, and subtract each of the point totals for each of the five games for 'x' sub 1 to 'x' sub 5. Apply some PEMDAS -- Parentheses first, then exponents, as well as addition and for our final step, we take the square root of 38 over 5 giving us approximately 2.757.
The last 5 games for the second player Cliff is scouting, Lance Layton, looked like this: Layton also played in 5 games, so 'n' equals five again. We need his scoring average next, so we total his scoring from the last 5 games and divide by n = 5, which gives us the averageand we find out that Lance Layton also averaged 20 points per game over the last 5 games. Let's look and see if Lance Leyton's standard deviation is as low as Martin McTry's. We just plug n=5 into the standard deviation formula as well as the mean, 20, and the per game scoring for 'x' sub 1 to 'x' sub 5 apply some PEMDAS again and finally, take the square root of 336 over 5 giving us approximately 8.198.
Comparing Martin McTry's and Lance Layton's recent scoring outputs, the average for both players over the past 5 games is 20 points per game. But with a standard deviation of 2.757, Martin McTry is a far more consistent player compared to Lance Layton with a standard deviation of 8.198.
After calculating the Standard Deviation for each player, Cliff is able to set up his team the way he wants. Cliff's excited to begin the path to the championship! Some reliable source - those might as well be their bingo scores!!!
Standard Deviation exercise
-
Calculate the standard deviation for Martin McTry.
HintsThe mean of the following list
$\begin{array}{cccc} 2&4&6&8 \end{array}$
is given by
$\bar x=\frac{2+4+6+8}4=\frac{20}4=5$.
The standard deviation of the list above is given by
$\begin{array}{rcl} \sigma&=&~\sqrt{\frac{(5-2)^2+(5-4)^2+(5-6)^2+(5-8)^2}4}\\ &=&~\sqrt{\frac{9+1+1+9}4}\\ &=&~\sqrt 5\\ &\approx&~2.236 \end{array}$
Keep PEMDAS in mind:
- First, determine the values inside the parantheses.
- Next, calculate the squares.
- Then add the squares.
- Divide the sum by the number of elements.
- Take the square root of the quotient.
SolutionTo calculate the standard deviation of Martin McTry's score, we first have to calculate the mean of those values.
The sum of all elements divided by the number of the elements, which is $5$:
$\bar x=\frac{21+18+16+24+21}{5}=\frac{100}5=20$.
The standard deviation is the square root of the average of the squares of the differences between each element of the set and the mean of the set:
$\begin{array}{rcl} \sigma&=&~\sqrt{\frac{(\bar x-21)^2+(\bar x-18)^2+(\bar x-16)^2+(\bar x-24)^2+(\bar x-21)^2}5}\\ &=&~\sqrt{\frac{1+4+16+16+1}5}\\ &=&~\sqrt{\frac{38}5}\\ &\approx&~2.757 \end{array}$.
-
Explain the elements in the standard deviation formula.
HintsThe mean is the sum of all elements divided by the number of elements.
The standard deviation gives information about the consistency of the elements of a list. It is dependent on the mean of the elements.
The standard deviation is the square root of the average of the squares of the differences between each element of the set and the mean of the set.
SolutionThe standard deviation is the square root of the average of the squares of the differences between each element of the set and the mean of the set:
$\sigma=\sqrt{\frac{(\bar x- x_1)^2+...+(\bar x- x_n)^2}n}$
- the Greek letter $\sigma$ is the common indicator for standard deviation
- $\bar x$ is the mean of the elements
- $x_i$, $i=1,~...,~n$ are the elements of the list
- $n$ is the number of the elements of the list
-
Calculate the standard deviation for the scoring.
HintsTo calculate the standard deviation, first you have to calculate the mean of the elements of the list.
The mean is the sum of all elements divided by the number of elements.
The standard deviation is the square root of the average of the squares of the differences between each element of the set and the mean of the set.
SolutionTo calculate the standard deviation for the list, first we have to calculate the mean. The mean is the sum of all elements divided by the number of all elements:
$\bar x=\frac{20+19+23+28+25+35}{6}=\frac{150}6=25$
The standard deviation is the square root of the average of the squares of the differences between each element of the set and the mean of the set:
$\begin{array}{rcl} \sigma&=&~\sqrt{\frac{(25-20)^2+(25-19)^2+(25-23)^2+(25-28)^2+(25-25)^2+(25-35)^2}6}\\ &=&~\sqrt{\frac{25+36+4+9+0+100}6}\\ &=&~\sqrt{\frac{174}6}\\ &\approx&~5.385 \end{array}$
-
Compare the standard deviation of each player with each other.
HintsFirst, calculate the mean per list. It is the sum of all elements divided by the number of all elements in one list.
All players have the same mean.
Here is the formula of the standard deviation:
$\sigma=\sqrt{\frac{(22-x_1)^2+(22-x_2)^2+(22-x_3)^2+(22-x_4)^2}4}$
The mean of each player is $22$.
SolutionThe mean is the same for all four players:
- Peter: $\bar x=\frac{22+23+24+19}4=22$
- John: $\bar x=\frac{23+21+25+19}4=22$
- Paul: $\bar x=\frac{25+21+25+17}4=22$
- Luke: $\bar x=\frac{19+21+19+29}4=22$
$\sigma=\sqrt{\frac{(22-x_1)^2+(22-x_2)^2+(22-x_3)^2+(22-x_4)^2}4}$
$~$
Peter
$\begin{array}{rcl} \sigma&=&~\sqrt{\frac{(22-22)^2+(22-23)^2+(22-24)^2+(22-19)^2}4}\\ &=&~\sqrt{\frac{0+1+4+9}{4}}\\ &=&~\sqrt{\frac{14}4}\\ &\approx&~1.871 \end{array}$
John
$\begin{array}{rcl} \sigma&=&~\sqrt{\frac{(22-23)^2+(22-21)^2+(22-25)^2+(22-19)^2}4}\\ &=&~\sqrt{\frac{1+1+9+9}{4}}\\ &=&~\sqrt{\frac{20}4}\\ &\approx&~2.236 \end{array}$
Paul
$\begin{array}{rcl} \sigma&=&~\sqrt{\frac{(22-25)^2+(22-21)^2+(22-25)^2+(22-17)^2}4}\\ &=&~\sqrt{\frac{9+1+9+25}{4}}\\ &=&~\sqrt{\frac{44}4}\\ &\approx&~3.317 \end{array}$
Luke
$\begin{array}{rcl} \sigma&=&~\sqrt{\frac{(22-19)^2+(22-21)^2+(22-19)^2+(22-29)^2}4}\\ &=&~\sqrt{\frac{9+1+9+49}{4}}\\ &=&~\sqrt{\frac{68}4}\\ &\approx&~4.123 \end{array}$
So Peter is the most consistent player, and Luke shows the least consistency.
-
Compare the results of the two players.
HintsThe bigger the standard deviation, the bigger the inconsistency.
Have a look at the following example:
Peter scores $40$ points in one game, but doesn't score at all in the next three games. He has a mean of $10$ points per game. Whereas Paul scores $10$ points per game in four games.
Which player would you prefer?
If Peter and Paul played for the same team, they would score $50$ points in one game and only $10$ points in each of the following three games.
SolutionYou can calculate the mean and the standard deviation from the given data points.
Let's have a look at the example:
- Martin McTry's score has a mean of $20$ and a standard deviation of approximately $2.757$.
- Lance Layton's score shows also a mean of $20$, but a standard deviation of $8.198$.
This shows that Martin is more consistent at scoring points than Lance. His actual number of scored points differ much less from the mean than those of Lance.
If Cliff's decision of who to pick for the team is based on consistency, he should then prefer Martin McTry.
-
Determine the standard deviation for each set of scores.
HintsKeep PEMDAS in mind:
- First, determine the values inside the parantheses.
- Next, calculate the squares.
- Then add the squares.
- Divide the sum by the number of elements.
- Take the square root of the quotient.
Here, you can see the beginning of the calculation of the standard deviation for the first list:
$\sigma=\sqrt{\frac{(\bar x-18)^2+(\bar x-22)^2+(\bar x-19)^2+(\bar x-24)^2+(\bar x-22)^2}5}$
$\bar x$ is the mean of the list.
The mean of the first list can be calculated this way:
$\bar x=\frac{18+22+19+24+22}5$
SolutionKeep in mind:
- The mean is the sum of all elements divided by the number of elements.
- The standard deviation is the square root of the average of the squares of the differences between each element of the set and the mean of the set.
$\begin{array}{l|c|c|c|c|c} \text{game}&\#1&\#2&\#3&\#4&\#5\\ \hline \text{score}&18&22&19&24&22 \end{array}$
$\bar x=\frac{18+22+19+24+22}5=\frac{105}5=21$
With the mean we can calculate the standard deviation:
$\begin{array}{rcl} \sigma&=&~\sqrt{\frac{(21-18)^2+(21-22)^2+(21-19)^2+(21-24)^2+(21-22)^2}5}\\ &=&~\sqrt{\frac{9+1+4+9+1}5}\\ &=&~\sqrt{\frac{24}5}\\ &\approx&~2.19 \end{array}$
Let's have a look at the next list
$\begin{array}{l|c|c|c|c} \text{game}&\#1&\#2&\#3&\#4\\ \hline \text{score}&19&21&23&21 \end{array}$
The mean is:
$\bar x=\frac{19+21+23+21}4=\frac{84}4=21$
Next, we can calculate the standard deviation:
$\begin{array}{rcl} \sigma&=&~\sqrt{\frac{(21-19)^2+(21-21)^2+(21-23)^2+(21-21)^2}4}\\ &=&~\sqrt{\frac{4+0+4+0}4}\\ &=&~\sqrt2\\ &\approx&~1.41 \end{array}$
There is just one list left
$\begin{array}{l|c|c|c|c|c|c} \text{game}&\#1&\#2&\#3&\#4&\#5&\#6\\ \hline \text{score}&19&21&23&21&17&22 \end{array}$
The mean is:
$\bar x=\frac{19+21+23+21+17+22}6=\frac{123}6=20.5$
Next, let's determine the standard deviation: $\begin{array}{rcl} \sigma&=&~\sqrt{\frac{(20.5-19)^2+(20.5-21)^2+(20.5-23)^2+(20.5-21)^2+(20.5-17)^2+(20.5-22)^2}6}\\ &=&~\sqrt{\frac{2.25+0.25+6.25+0.25+12.25+2.25}6}\\ &=&~\sqrt{\frac{23.5}6}\\ &\approx&~1.98 \end{array}$


upload more sports videos
Great! I'm glad the video was helpful! We'll continue to work hard to provide you with fun, accessible explanations.
This is helpful for understanding standard deviation! Thank you so much!