Mean, Median, Mode, Range

Basics on the topic Mean, Median, Mode, Range
The mean, median, mode, and range are measurements used to help make sense of a data set. They give different ways of seeing where the data tends. The mean, or average, is a useful way to measure the tendency of a data set when there are no extreme values in the set. When there are extreme values, the median can be more useful, as it is the middle value of a data set, when the set is arranged in ascending order. The mode is the value which occurs most often in the data set, and thus gives the most common value in a data set. The range is the difference between the largest and smallest values in the set, and gives an idea of how spread out the data set is. Learn more about these data set measurements by helping to analyze the outcome of the Annual Bratwurst Eating Contest in Austin, Texas. Common Core Reference: CCSS.MATH.CONTENT.6.SP.B.5.C
Transcript Mean, Median, Mode, Range
This year, the Annual Bratwurst Eating Contest will be held in Austin, Texas, and a team from the US, a team from Canada and of course, the German team will compete.
It's too bad. Kornelius, a member of the German team is otherwise engaged, so he can’t attend the contest. But Stephan, the captain of the German team, has an ace up his sleeve. I wonder what he's up to. The winner of the Annual Bratwurst Eating Contest is the team with the highest mean number of brats consumed. But, teams will be rewarded for the biggest range as well as excellence in the three methods of calculating the central tendency of a set: Mean, Median and Mode.
Calculating the mean
Let’s help the judges calculate the mean. The mean is the sum of all elements in a set divided by the total number of elements in the set. The mean is also known as the average of a data set. To calculate the mean for each team, we first have to add the number of brats consumed by each member of each team, and then divide that sum by the number of team members, or addends.
Germany has a mean of 43, while team USA has a mean of 36. The Canadian team has a mean of 23 – as you can see, to calculate their mean score, we divided the sum of the bratwurst eaten by 4 since there are only 4 members of their team and therefore, 4 addends. Does the mean truly reflect the center of the data for each team? Some of the numbers seem to be too high or too low… Numbers that are higher or lower than the other numbers in a data set are called outliers, and they can skew the mean, higher or lower. So... maybe the mean is not the best measure of central tendency.
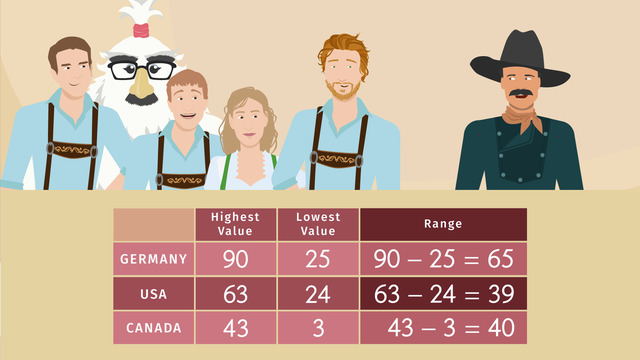
Let’s investigate this situation a little more. Take a look at the range. The range is the difference between the maximum and minimum values, highest and lowest, respectively, in a data set. A high range indicates a large difference between the maximum and minimum values in a set and may be an indicator of the presence of outliers. Wow, the range of the data for the German team is 65!
Is there an outlier? Let's take another look at the data. One member of the German team ate 90 bratwurst! Hmmm, that seems strange. Uh oh! I hope this doesn't cause an international incident, but the Americans just pointed out that one of the members of the German team is a Yeti, and he's the team member that ate 90 bratwurst! Since there's no precedent for having a Yeti on a team, the judges hold a quick meeting to decide what to do. Will the German team be disqualified?
Calculating the median
The judges have decided. To be fair to the teams from America and Canada, the judges will use the median to determine the winner. When outliers are included in a data set, the median, the central value of a data set, may give the best measure of central tendency. To find the median, order the data from lowest to highest. The median is the middle number. If there are an even number of elements in the set, you simply have to average the two middle values.
How about that? The German team is still the winner of the contest! This doesn’t seem fair, but the evidence is clear. The Germans have the highest mean AND median, so the they win first place.
Determining the mode
There's also a prize for the team with the highest mode, or the data value that is repeated the most. Let’s take a look. The Germans and Americans have no data values that repeat, so both teams have NO mode but for the Canadians, the value 23 repeats twice, so they take the prize for the highest mode!
Well, lookey here, it seems like they've all succumb to food coma. I guess their eyes were bigger than their stomachs. Most of them, anyway.
Mean, Median, Mode, Range exercise
-
Determine the information that the table shows.
HintsMember $3$ from the German team ate $31$ bratwursts and Member $4$ from the Canadian team ate $43$ bratwursts.
The mean of the German team is $\frac{25+40+31+29+90}{5}=\frac{215}{5}=43$.
The mode is the number that occurs the most in a data set. The German and US teams have no mode because each data value shows up the same amount of times.
The range of the Canadian team is $43-3=40$.
Solution- We are not given the names of the team members.
- We can see the number of bratwursts eaten by each member of the team. For example, Member $3$ from the German team has eaten $31$ bratwursts, and Member $4$ from the Canadian team has eaten $43$ bratwursts. We can also see that Team Canada only has $4$ members.
- We can use the information from the table to find the mean. However, it takes some calculating. We calculate the mean as the sum of all elements divided by the number of the elements.
- We can also determine the median as the middle of the ordered list, if the number of elements is odd, for example, the median of Team USA is given by $30$. If the number is even, as the data set of Team Canada, the median is the average of both middle data values of the ordered list: $\frac{23+23}{2}=23$.
- There is only one team, Canada, that we can determine the mode for, the data value that's shown most. Canada's mode is $23$. The German and US teams have no mode because each data value shows up the same amount of times.
- With this table we can determine the range for each team as the difference between the highest and the lowest data value.
- Team Germany's range: $90-25=65$.
- Team USA's range: $63-24=39$.
- Team Canada's range: $43-3=40$.
-
Explain how to find the median, mode, and range of a data set.
Hints$\begin{array}{c|c|c|c|c} \text{Member 1}&\text{Member 2}&\text{Member 3}&\text{Member 4}&\text{Member 5}\\ \hline 25&40&31&29&90 \end{array}$
The mean of this data set is $43$. As you can see from the table, four elements are lower and just one data element is higher than $43$.
$\begin{array}{c|c|c|c|c} \text{Member 1}&\text{Member 2}&\text{Member 3}&\text{Member 4}&\text{Member 5}\\ \hline 25&40&31&29&90 \end{array}$
The data elements can be rewritten as $25$, $29$, $31$, $40$, $90$. The median of this list is given by $31$.
$\begin{array}{c|c|c|c|c} \text{Member 1}&\text{Member 2}&\text{Member 3}&\text{Member 4}&\text{Member 5}\\ \hline 25&40&31&29&90 \end{array}$
This data set doesn't contain a mode.
$\begin{array}{c|c|c|c|c} \text{Member 1}&\text{Member 2}&\text{Member 3}&\text{Member 4}&\text{Member 5}\\ \hline 25&40&31&29&90 \end{array}$
The range of this data set is $90-25=65$.
SolutionWhen examining data sets you can use measures of central tendency (mean, median, and mode) or range, as a measure of dispersion, to describe the set.
Measures of Central Tendency
- The mean, also known as the average, is the sum off all elements of the set divided by the number of elements.
- The median is the middle of the ordered set. So you first have to order a given data set and then take the middle of an odd numbered set. If the number of elements is even, you take the average of the both elements in the middle.
- The mode of a data set is the data value that's repeated most. If all numbers in the set occur the same amount of times then there is no mode.
- The range of a data set is defined as the difference between the highest and lowest data value.
-
Determine the mean and the median of the data set.
HintsThe mean of the following list $2$, $4$, $4$, $3$, $7$ is calculated by $\dfrac{2+4+4+3+7}{5}=\dfrac{20}{5}=4$.
The average of two numbers is the sum of those numbers divided by $2$.
For example, the average of $12$ and $36$ is $\frac{12+36}2=\frac{48}2=24$.
To get the median of any data list you first have to order it, starting with the lowest value.
The median separates the list in two list, both with the same number of elements.
SolutionFrom this table you see the ordered list of Aaron and Blake's number of goals. It's only important to order the list for the median, but you can also calculate the mean of an ordered list.
Aaron:
- The mean is the sum of all elements divided by the number of the elements: $\frac{0+3+4+4}{4}=\frac{11}{4}=2.75$. Note, that the mean doesn't have to belong to the data set.
- The median is the middle number of an ordered data set. If the ordered list is even, the median is the average of the both middle data values. Here, the median is $\frac{3+4}{2}=\frac{7}{2}=3.5$. The median also doesn't have to belong to the data set.
- The mean is given by $\frac{1+2+3+5}{4}=\frac{11}{4}=2.75$.
- We calculate the median as follows: $\frac{2+3}{2}=\frac{5}{2}=2.5$.
- Aaron and Blake have the same mean of $2.75$.
- Aaron has a greater median than Blake.
- Because Aaron's median is greater we can consider Aaron the winner.
-
Calculate the mean, median, mode, and range of the given data set.
HintsThe mean is the sum of all elements divided by the number of elements.
The data values have been ordered for you: $14$, $16$, $16$, $17$, $21$, $21$, $21$.
The median is the middle of the ordered list.
The mode is the data value that's repeated most.
The range is the difference between the highest and the lowest value.
SolutionFirst we put the data set in order: $14$, $16$, $16$, $17$, $21$, $21$, $21$.
- We can determine the range as the difference between the highest, $21$, and the lowest, $14$, data value; thus, $21-14=7$.
- The mean is the sum of all elements divided by the number of the elements: $\dfrac{14+16+16+17+21+21+21}7=\frac{126}7=18$.
- The median is the middle of the ordered list. Here it is $17$.
- The mode is the data value that's repeated most: $21$.
-
Explain how to calculate the mean.
HintsThe mean is also known as the average.
For example the average, also known as mean, of $10$ and $12$ is given by $\frac{10+12}2=\frac{22}2=11$.
If you multiply the mean by the number of all elements you get the total sum of all the bratwursts eaten.
SolutionThe mean of a data set is the sum of all elements of the set divided by the total number of the elements. It's also known as the average.
Using the results of the German team:
$\begin{array}{c|c|c|c|c} \text{Member 1}&\text{Member 2}&\text{Member 3}&\text{Member 4}&\text{Member 5}\\ \hline 25&40&31&29&90 \end{array}$
- We first add all numbers of bratwursts: $25+40+31+29+90=215$.
- Next, we divide this sum by $5$, the number of all elements. This gives us the mean $\frac{215}5=43$.
-
Determine the mean, median, and range of the following data sets.
HintsThe range is the difference between the highest and the lowest data value.
The mean is the sum of all elements divided by the number of the elements.
The median is the middle of the ordered list.
If the number of elements is even, the median is the average of the both elements in the middle.
Let's have a look at this example: $2$, $3$, $7$, $9$
- The mean: $\frac{2+3+7+9}4=\frac{21}4=5.25$
- The median: $\frac{3+7}2=\frac{10}2=5$
- The range: $9-2=7$
SolutionMean is the sum of all the data values divided by the total number of values. Median is the middle number in the ordered data set. Range is the difference between the highest and lowest data values.
Carlos' information: $3$, $7$, $9$, $5$
- The mean: $\frac{3+7+5+9}4=\frac{24}4=6$
- The median: First order the set $3$, $5$, $7$, $9$. Then find the number in the middle $\frac{5+7}2=\frac{12}2=6$
- The range: $9-3=6$
Alexis' information: $3$, $7$, $8$, $9$, $5$
- The mean: $\frac{3+7+8+9+5}5=\frac{32}5=6.4$
- The median: $3$, $7$, $7$, $8$, $9$ the middle of the ordered list is $7$.
- The range: $9-3=6$
- The mean: $\frac{5+7+9+5+12+4}6=\frac{42}6=7$
- The median: $4$, $5$, $5$, $7$, $12$, the middle number of the ordered list is $\frac{5+7}2=\frac{12}2=6$
- The range: $12-4=8$





Hi Ruth Guenther,
Thank you for your comment and we are happy to hear that you like the video.
Of course the answer 6.4 is correct. It was a technical mistake on our side, because we wanted to make sure 6.4 and 6.40 can be counted as a correct answer. This mistake has been fixed now. Thank you so much for letting us know.
Nice Video.
But what does 6.4!!6.40 in the solution for problem 5 mean? I tiped 6.4 in and it was said to be wrong.