Quartiles and Interquartile Range

Basics on the topic Quartiles and Interquartile Range
Summary of Quartiles and Interquartile Range
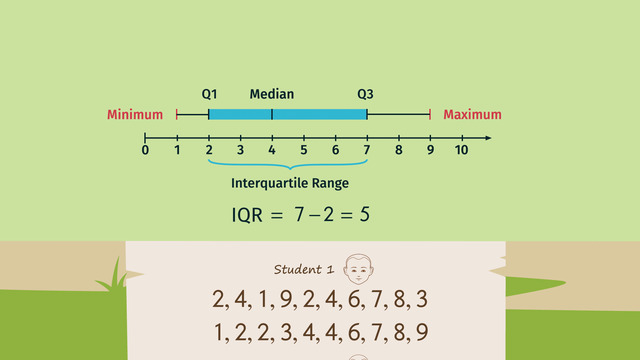
To compute the interquartile range of a given set of data, it is important to first understand the concept of quartile, as the Interquartile range (IQR) is a measure of variability, based on dividing a data set into quartiles.
Quartiles divide an ordered data set into four equal parts. The values which divide each part are called the first, second, and third quartiles; they are denoted by Q1, Q2, and Q3, respectively.
- Q1 is the middle value of the first half of the ordered data set
- Q2 is the median value in the set
- Q3 is the middle value in the second half of the ordered data set
The Interquartile Range is (IQR) = Q3 – Q1.
This video shows you an example on how to compute the interquartile range.
The following steps are a big help in computing interquartile range:
- First, arrange the data set into ascending order. For example: 1,3,4,5,5,6,7,7,11,13,15.
- Next, find the first quartile (Q1) and third quartile (Q3) of the given data set. Q1 is the median or middle value of the first half of the data set while Q3 is the median or middle value of the second half. Given the data set above, the set 1,3,4,5,5 is the first half while 7,7,11,13,15 is the second half. Thus, Q1 = 4 and Q3 = 11. Note that when the data set has two middle values, then get the average of the two numbers in order to get the exact values of the quartiles.
- Lastly, compute the interquartile range (IQR) by subtracting Q1 from Q3. So for our example we have that IQR = Q3 – Q1 = 11 – 4 = 5.
The interquartile range is used to construct box plots and to find outliers in a data set, thus giving a deeper understanding of the relationship of the data points and the data set as a whole.
Summarize and describe distributions.
Common Core
CCSS.MATH.CONTENT.6.SP.B.5.C
Let's practice: interquartile range, quartile range Exercises
With the following exercises on the topic of interquartile range, quartile range, you can test whether you have understood everything. Test your knowledge now!
Transcript Quartiles and Interquartile Range
"Many archers, who all shoot brilliantly, on a Medieval castle ground is where we lay our scene. From fierce competition break to new scrutiny, Where quartiles determine the archers' destinies."
Romeo has entered an archery competition devised by the King based on quartiles. The rules of the competition are a little bit different from the competitions Romeo usually enters. Upon hearing that Juliet lives in the castle, Romeo is trying to find a way they can finally be together. However, in order to avoid the punishments, Romeo has to understand quartiles and interquartile range.
Quartiles and interquartile range
(A) The archers in the 4th quartile range are rewarded by being automatically knighted and sent to look for the Holey Grail, (B) while the archers in the 1st quartile range have the unfortunate lot of being the ones upon whose heads the target apples will sit next year. (C) Anyone falling in the lower part of the interquartile range has to clean up after the festival. (D) and anyone in the upper part of the interquartile range gets to stay in the castle during the festival. That's what Romeo wants. Additionally, if the competition isn't very good and the interquartile range is greater than 10, then all the archers in the interquartile range must help with the festival clean up.
Using quartiles
One way to analyze data is to use quartiles, which is just a fancy way of saying the data is divided into quarters. The competition between the kingdom's brave archers has just ended! Let's see what fate has in store for Romeo and Juliet. In our data set, we have several archers who had to shoot 20 apples each and managed to hit between 0 and 20 apples. Boy, that looks messy. In order to split the data into quartiles, we first need to put the numbers in order and done.
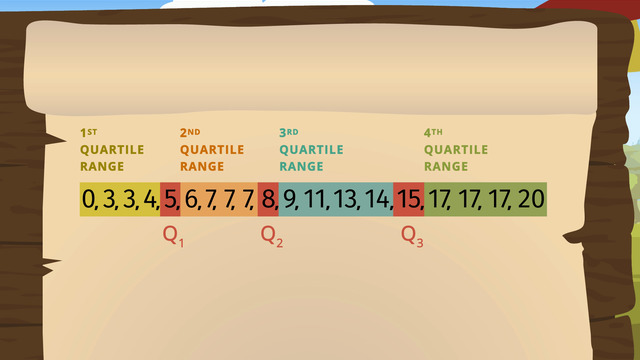
Let's take a look at a few of the ways to split this data. For this method, you need to know how many data points you have, so count those first.19. Good. We first need to split the list in two equal halves. If there is an odd number of data points, as in the example, then the middle number, 8, becomes the median and is not included in either half. We'll call this Q2. Once we have two halves, we want to split these into further halves, giving us four sets of data with an equal number of data points in each set. Let's look at the first half of the list first. It has 9 elements, so the median will not be included in either quartile. Five is the median of the first half, so we'll call this Q1.
So our first quartile has the following data points: These poor souls will be the apple stands at next year's competition and our second quartile range has the following data points. Those archers have to clean up once the festival is done.Doing the same to the second half of the list gives us a median of 15. So our Q3 is 15 and the 3rd as well as the 4th quartile ranges.
The brave warriors in the 4th quartile range are automatically knighted and sent off in search of the Holey Grail. If there is an even number of data points, then we split the list in half and take the median of the two middle-most numbers. So, just to illustrate what we mean, let's say you have an even number of data points like in our 3rd quartile range. Splitting these up into sets with the same number of elements is easy: all we have to do is put two data points in each set. But where's the median of this data set including 4 values? As we said before, we split the list in half and take the median of the two middle-most numbers. In our case, the middle-most numbers are 11 and 13. The median between these two numbers is 11 plus 13 divided by two, so 12 is our median.
The interquartile range
Now that we understand how to split the data into quartiles, all the bean counter needs to figure out is whether or not anyone gets to stay in the castle. For this, we need the interquartile range. The interquartile range is found by subtracting Q1 from Q3.
So 10 is the interquartile range for our data. Whew! Not all the archers have to clean up after the festival! Since Romeo finished the competition with a score of 14, we can now safely say that he is in the upper portion of the interquartile range and gets to stay in the castle where he'll be close to his lady love! But, there's something fishy about one of the newly-knighted knights.
"Go hence, to have more talk of these sad things: Some shall be empower’d, and some employed: For never was a story of more woe Than this of Juliet and her Romeo."
Quartiles and Interquartile Range exercise
-
Explain how to find the interquartile range.
HintsHere you see the list ordered.
Usually the data gets ordered first.
For an odd number of data points we get two sets, one left of of the median and one right of the median, with an equal number of data points.
SolutionTo get the interquartile range, we have to proceed with the following steps:
- Order the data, as pictured to the right.
- Count the total number of data points, $19$.
- Split the list into two equal halves. Because the number of data points is odd, the median is right in the middle at position $10$ and we have that $Q_2=8$.
- Split the lower as well as the upper part of the list, each containing $9$ elements. So we get $Q_1=5$ as the median of the lower part and $Q_3=15$ as the median of the upper part.
- The interquartile range is defined as the difference of $Q_3$ and $Q_1$. So we get $IQR=Q_3-Q_1=15-5=10$.
-
Determine the median, the quartiles, and the interquartile range.
HintsIf you've got an odd number of data points the median lies right in the middle of the list of data. For example, $4$ is the median of the list
$\begin{array}{ccccccc} 1&2&3&4&5&6&7 \end{array}$
For the list pictured, we have that:
- $Q_2=4$
- $Q_1=2$
- $Q_3=6$
- $IQR=6-2=4$
SolutionTo get the interquartile range, we have to proceed with the following steps:
- Order the data, as pictured to the right.
- Count the total number of data points, $19$.
- Split the list into two equal halves. Because the number of data points is odd, the median is right in the middle at position $10$ and we have that $Q_2=8$.
- Split the lower as well as the upper part of the list, each containing $9$ elements. So we get $Q_1=5$ as the median of the lower part and $Q_3=15$ as the median of the upper part.
- The interquartile range is defined as the difference of $Q_3$ and $Q_1$. So we get $IQR=Q_3-Q_1=15-5=10$.
- The first quartile range starts with $0$ and ends with $4$.
- The second quartile range starts with $6$ and ends with $7$.
- The third quartile range starts with $9$ and ends with $14$.
- The fourth quartile range starts with $17$ and ends with $20$.
-
Determine the median, the quartiles, and the interquartile range.
HintsTo get the mean of two numbers add them and divide the sum by $2$.
The number of data points in the list pictured is $6$.
The median is the mean of the data points at position $\frac 62=3$ and $4$; i.e. the mean of $9$ and $11$, which is
$\frac{9+11}2=\frac{20}2=10$.
SolutionHere we have an ordered list with $20$ data points, an even number.
The median lies between the data points at position $\frac{20}2=10$ and position $11$; i.e. between the data points $7$ and $9$. We take the mean of these points as the median:
$\frac{9+11}2=\frac{20}2=10$.
Thus we can conclude that $Q_2=10$.
We proceed in a similar fashion for the lower part of this list,
$\begin{array}{cccccccccc} 1&1&3&4&5&5&6&7&8&9 \end{array}$
$Q_1=\frac{5+7}2=\frac{12}2=6$,
and for the upper one,
$\begin{array}{cccccccccc} 11&12&12&13&14&16&16&17&18&20 \end{array}$
$Q_3=\frac{14+16}2=\frac{30}2=15$.
Finally we can determine the interquartile range as the difference of $Q_3$ and $Q_1$:
$IQR=15-6=9$.
-
Calculate which data points are in which quartile range.
HintsFirst order the data list.
This is the ordered list.
Each quartile contains $4$ data points.
Be careful: the medians should not be highlighted.
SolutionFirst you have to order the list of data. You can see the ordered list to the right.
Next determine the medians $Q_1$, $Q_2$, and $Q_3$ which divide the list in the four quartile ranges.
Let's start with $Q_2$; it's right in the middle of the starting list: $Q_2=17$.
The middle of the lower part,
$\begin{array}{ccccccccc} 2&5&7&7&9&10&10&13&16, \end{array}$
is $Q_1=9$.
The middle of the upper part,
$\begin{array}{ccccccccc} 19&20&20&22&24&25&26&26&26, \end{array}$
is $Q_3=24$.
Thus we have the following quartiles:
- The first one: $\begin{array}{cccc}2&5&7&7\end{array}$
- The second one: $\begin{array}{cccc}10&10&13&16\end{array}$
- The third one: $\begin{array}{cccc}19&20&20&22\end{array}$
- The fourth one: $\begin{array}{cccc}25&26&26&26\end{array}$
-
Identify how to find the median.
HintsFor this list the median is $7$.
For this list the median is the mean of $7$ and $9$.
For the example above, the mean is $\frac{7+9}2=\frac{16}2=8$.
SolutionHow can we find the median of a given ordered list?
We have to differentiate between two cases:
- The number of data points is odd.
- The number of data points is even.
Let's start with an odd number of data points:
$\begin{array}{ccccc} 2&5&7&8&12 \end{array}$
The median is the data point lying right in the middle of the list, in this example at position $3$. So we have that the median is $7$. The median belongs to the list of data.
Now let's see what we do when we have an even number of data points:
$\begin{array}{cccccc} 2&5&7&9&12&13 \end{array}$
The median lies between $7$ and $9$. So we take the mean of those values as the median:
$\frac{7+9}2=\frac{16}2=8$.
This median could belong to the list of data, but not always.
Independent of even or odd numbers, we can conclude that the median splits the list into two parts containing the same number of data points.
-
Determine the median, the quartiles, and the interquartile range.
HintsFirst order the given list.
This is the ordered list.
The number of data points is $13$ and thus odd. So the median is right in the middle of the ordered list.
The number of data points in the lower as well as the upper part of the list is $6$ and thus even. So the median is the mean of both data points lying in the middle.
SolutionFirst determine $Q_1$, $Q_2$, and $Q_3$.
$Q_2$ is the median of the ordered list. Because the number of data points is odd, namely $13$, the median is right in the middle. Thus we have $Q_2=26$.
The lower as well as the upper part of the list contains $6$ data points. So we have to determine the corresponding median as the mean of both of the data points lying in the middle.
Let's start with $Q_1$:
$\begin{array}{cccccc} 9&12&\mathbf{15}&\mathbf{16}&21&23 \end{array}$
So $Q_1=\frac{15+16}2=\frac{31}2=15.5$.
Now, to determine $Q_3$:
$\begin{array}{cccccc} 28&33&\mathbf{35}&\mathbf{37}&41&44 \end{array}$
So $Q_3=\frac{35+37}2=\frac{72}2=36$.
With $Q_3$ and $Q_1$ known, we can calculate the interquartile range:
$IQR=Q_3-Q_1=36-15.5=20.5$
We can now establish the quartile ranges:
- The first one: $\begin{array}{ccc}9&12&15\end{array}$
- The second one: $\begin{array}{ccc}16&21&23\end{array}$
- The third one: $\begin{array}{ccc}28&33&35\end{array}$
- The fourth one: $\begin{array}{ccc}37&41&44\end{array}$
