Line of Best Fit


Basics on the topic Line of Best Fit
A line of best fit is a line that best represents the data of a scatter plot. It is as close as possible to all points; it may pass through some of the points, none of the points, or all of the points. The line of best fit can be used as a tool for analyzing investment risk or trading activity. It is also used in regression analysis and is a key tool for statistical calculations such as the sum of squares. Learn how to compute the line of best fit for a scatter plot by helping Valentine Verne on his treasure hunt in the deep blue ocean. Common Core Reference: CCSS.MATH.CONTENT.8.SP.A.2
Transcript Line of Best Fit
Valentine Verne is on a treasure hunt in the deep blue ocean. He has heard many tales of treacherous plants and animals standing between sailors and a storied treasure.
Valentine uses his radar to map out where the obstacles are. There are two routes that Valentine can take. He needs to find the line of best fit so that he won’t get too close to any of the sea critters in his way. To do this, he must understand Lines of Best Fit. Let’s take a look at Valentine’s journey.
The line of best fit
In scatter plots, the line of best fit is a line that is as close as possible to all points on the graph, with as many points above the line as below. The easy way to figure out which of two given lines is the line of better fit, is to calculate the residuals of the two lines.Residuals?! Residuals are the differences between the y-values of each point, in our case the obstacles, and the y-values of the line in question. The two different routes are shown here. Valentine knows that the lower the sum of the squares of the differences in y-values, the better the line fits to the data. Let’s take a look at the obstacles in Valentine’s way.
Determining the residuals
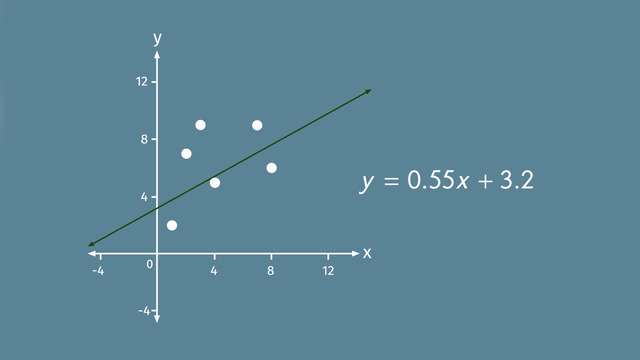
Valentine’s route is shown here by the equation 'y' is equal to 0.55x plus 3.2. To figure out if the route is a good fit, we'll use a table. First, we need the coordinates of all points, as well as the ‘y’ values when the ‘x’ coordinates are substituted into the equation of the line. Next, we determine the residuals, which is the difference between the two y-values. The last step is to sum the squares of the residuals. The line with the smaller sum is the line of better fit.
Here, we use the x- and y-coordinates of the obstacles, for example, (1, 2). To determine the corresponding y-value of the route, we plug the x-value, 1, into our equation for the route, y=0.55x+3.2. Doing so gives us 3.75. Now it's time to determine the residual for this point, which again, is the difference between the two y-values. 2 minus 3.75 is -1.75. As always, the last step is to square our sum, giving us 3.0625.
We repeat this process for each obstacle in our list: write down their coordinates plug in the x-value into the equation of the route to find the corresponding y-value, determine the residual, or the difference of the two y-values, and of course, square the result. Finally, we sum all the squares, which gives us 34.0975.
Now, let's have a look at the second route to see if it is a better fit. The equation for this line is y=0.4x plus 4.65. Remember: the obstacles still have the same coordinates. So, the first column of the table contains the coordinates for the obstacles, just as before.
But beware:
When finding the y-values that correspond to these x-values, we have to plug the values for 'x' into the equation for the new line.
Again, determine the differences of the two y-values next to get the residuals, and square the results. As always, our final step is to sum the squares.
We're left with 27.695, which is less than the 34.0975 we obtained from the first route. Comparing the two sums, Valentine has to choose the lower residual value of the two lines since the line of best fit is always the LEAST squares line.
He chooses the second line and off he goes!
Line of Best Fit exercise
-
Explain what the line of best fit is.
HintsThe blue line seen here is the line of best fit.
Neither of these lines have a point lying on them.
A best fitting line means that the sum of the distances of the given points to the line is as small as possible.
SolutionThe line of best fit is the line that is as close as possible to all points on the graph with as many points above the line as below it.
The way to figure out which line is the best fitting line is to calculate the residuals of the regarding line. This is the difference of the $y$-values of the line and the corresponding y-coordinate of the given point.
The lower the sum of the squares of the differences in $y$-values, the better the line fits to the data.
-
Identify how to tell which line fits better when two lines are given.
HintsUsing this graph, fill in the table from left to right for each given point.
In the table, we have the $y$-value of the line from substituting the $x$-value $1$ into the equation $y=0.55x+3.2$.
The difference of the $y$-values is also known as the residual.
The sum of least squares is needed to determine the line of better fit.
SolutionTo check if a given line is the better fitting line, we need its corresponding linear equation. For example we can use $y=0.55x+3.2$.
For each point we proceed as follows:
- We record the coordinates of each point in the table. Here the ordered pair $(1,2)$.
- We substitute the $x$-value of this point in to the linear equation of the line to get the corresponding $y$-value. Here $y=0.55(1)+3.2=3.75$.
- We determine the residual, that means the difference between the two $y$-values. In this case $y_\text{coor.}-y_\text{line} = 2 - 3.75 = -1.75 $
- Next, we square the residual. $(-1.75)^2=3.0625$. We'd do steps $1$-$4$ with each point.
- Then we'd sum all the squares and compare it to the other lines to find the one with the sum of least squares. That line is the line of best fit.
-
Decide which line fits the best when the following residuals are given.
HintsYou have to sum the squares of the residuals.
The lower the sum of the squares of the differences in $y$-values, the better the line fits to the data.
The sum of squares of the worst fitting line is given by $32.25$.
SolutionFor each of the given tables, you still have to sum the squares and compare the squares.
Keep in mind that The lower the sum of the squares of the residuals, differences in $y$-values, the better the line fits to the data.
So we get the following order:
$\begin{array}{c} \mathbf{y=x+1}\\\\ \begin{array}{c|c|c|c} (x,y_1)&y_2&y_1-y&(y_1-y)^2\\ \hline (1,3)&2&1&1\\ \hline (2,4)&3&1&1\\ \hline (4,5.5)&5&0.5&0.25\\ \hline (6,6)&7&-1&1\\ \hline &&&\text{sum: }~~ 3.25 \end{array} \end{array}$
$\begin{array}{c} \mathbf{y=1.5x-1}\\\\ \begin{array}{c|c|c|c} (x,y_1)&y_2&y_1-y&(y_1-y)^2\\ \hline (1,3)&0.5&2.5&6.25\\ \hline (2,4)&2&2&4\\ \hline (4,5.5)&5&0.5&0.25\\ \hline (6,6)&8&-2&4\\ \hline &&&\text{sum: }~~ 14.5 \end{array} \end{array}$
$\begin{array}{c} \mathbf{y=1.5x+1}\\\\ \begin{array}{c|c|c|c} (x,y_1)&y_2&y_1-y&(y_1-y)^2\\ \hline (1,3)&2.5&0.5&0.25\\ \hline (2,4)&4&0&0\\ \hline (4,5.5)&7&-1.5&2.25\\ \hline (6,6)&10&-4&16\\ \hline &&&\text{sum: }~~ 18.5 \end{array} \end{array}$
$\begin{array}{c} \mathbf{y=2x-1}\\\\ \begin{array}{c|c|c|c} (x,y_1)&y_2&y_1-y&(y_1-y)^2\\ \hline (1,3)&1&2&4\\ \hline (2,4)&3&1&1\\ \hline (4,5.5)&7&-1.5&2.25\\ \hline (6,6)&11&-5&25\\ \hline &&&\text{sum: }~~ 32.25 \end{array} \end{array}$
-
Calculate the sum of squares of the following line.
HintsSubstitute the left coordinate of each ordered pair in to the equation $y=0.5x+2$.
So you get $y_{\text{line}}$.
Be cautious about the way you order the difference.
The square of any number is always a positive number. For example $(-2)^2$ is $4$.
You only have to put in the corresponding results.
SolutionTo decide if a given line fits the data, we will we have to calculate the residuals, respectively their squares, and then sum those squares. This sum is a measure for the goodness of fit of the line.
If you have to compare two lines, or more lines, the sum of least squares is the way to find the best fitting line.
$~$
$(1,3)$
- $y_{\text{line}}=0.5(1)+2=2.5$
- $y_{\text{point}}-y_{\text{line}}=3-2.5=0.5$
- $(y_{\text{point}}-y_{\text{line}})^2=0.5^2=0.25$
$(2,2)$
- $y_{\text{line}}=0.5(2)+2=3$
- $y_{\text{point}}-y_{\text{line}}=2-3=-1$
- $(y_{\text{point}}-y_{\text{line}})^2=(-1)^2=1$
$(3,3)$
- $y_{\text{line}}=0.5(3)+2=3.5$
- $y_{\text{point}}-y_{\text{line}}=3-3.5=-0.5$
- $(y_{\text{point}}-y_{\text{line}})^2=(-0.5)^2=0.25$
$(4,5)$
- $y_{\text{line}}=0.5(4)+2=4$
- $y_{\text{point}}-y_{\text{line}}=5-4=1$
- $(y_{\text{point}}-y_{\text{line}})^2=1^2=1$
Finally, we sum all those squares to get $0.25+1+0.25+1=2.5$.
-
Determine the $y$-value of the given line.
HintsKeep in mind that the first coordinate is the $x$-coordinate.
Substitute the corresponding $x$-coordinate into the linear equation.
Looking at an example: $(8,6)$
The corresponding $y$-value is given as follows:
$y=0.55(8)+3.2=7.6$.
SolutionWe need the $y$-values according to each point. So we put the $x$-coordinate, the first or the left coordinate, in the corresponding linear equation.
- $(1,2)$ $\rightarrow$ $y=0.55(1)+3.2=3.75$
- $(3,9)$ $\rightarrow$ $y=0.55(3)+3.2=4.85$
- $(2,7)$ $\rightarrow$ $y=0.55(2)+3.2=4.3$
- $(7,9)$ $\rightarrow$ $y=0.55(7)+3.2=7.05$
-
Decide which line fits better to the given three points.
HintsProceed as follows for each point and for each line:
- Put the $x$-coordinate in the equation.
- Determine the differences of the $y$-values. Those are the residuals.
- Square the residuals.
- Sum all given squares.
The lower the sum of the squares of the differences in $y$-values, the better the line fits to the data.
Both sum of squares lie between $2$ and $3$.
Keep the signs in mind.
SolutionHere we have to decide which of the two given lines fits better to the given points.
Let's start with the green, one $y=0.5x+0.5$.
$(1,2)$
- $y_{\text{line}}=0.5(1)+0.5=1$
- $y_{\text{point}}-y_{\text{line}}=2-1=1$
- $(y_{\text{point}}-y_{\text{line}})^2=1^2=1$
$(2,2)$
- $y_{\text{line}}=0.5(2)+0.5=1.5$
- $y_{\text{point}}-y_{\text{line}}=2-1.5=0.5$
- $(y_{\text{point}}-y_{\text{line}})^2=0.5^2=0.25$
$(4,3.5)$
- $y_{\text{line}}=0.5(4)+0.5=2.5$
- $y_{\text{point}}-y_{\text{line}}=3.5-2.5=1$
- $(y_{\text{point}}-y_{\text{line}})^2=1^2=1$
$~$
Next, we determine the sum of squared residuals also for the blue line $y=1.2x$.
$(1,2)$
- $y_{\text{line}}=1.2(1)=1.2$
- $y_{\text{point}}-y_{\text{line}}=2-1.2=0.8$
- $(y_{\text{point}}-y_{\text{line}})^2=0.8^2=0.64$
$(2,2)$
- $y_{\text{line}}=1.2(2)=2.4$
- $y_{\text{point}}-y_{\text{line}}=2-2.4=-0.4$
- $(y_{\text{point}}-y_{\text{line}})^2=(-0.4)^2=0.16$
$(4,3.5)$
- $y_{\text{route}}=1.2(4)=4.8$
- $y_{\text{point}}-y_{\text{line}}=3.5-4.8=-1.3$
- $(y_{\text{point}}-y_{\text{line}})^2=(-1.3)^2=1.69$
$~$
Because $2.25<2.49$, we can conclude that the green line fits the given three points better than the blue one. However, please note that neither of these lines represent the actual line of best fit because as you can see with the green one all the points are above the line.