Reviewing Representations of Ratios


Basics on the topic Reviewing Representations of Ratios
After this lesson you will be able to apply your knowledge of ratios to many real world scenarios.
The video begins with a review of ratio notation and how to find unit rate. It continues with how to use ratio tables and tape diagrams to find equivalent and associated ratios. It concludes with a review of ratios in graphs, and finding the constant of proportionality.
Review representations of ratios by going on a free-sample shopping spree, with Segway Sam at the supermarket!
This video includes key concepts, notation, and vocabulary such as: ratio (a comparative, proportional relationship between two amounts); equivalent ratios (two ratios which represent the same proportional relationship); tape diagrams (a diagram used to visualize a set of equivalent ratios); ratio tables (a table of equivalent ratios); unit rate (a proportional relationship which compares a quantity to one unit of another quantity).
Before watching this video, you should already be familiar with writing ratios, simplifying ratios, tape diagrams, ratio tables, and plotting ratios on a coordinate plane.
After watching this video, you will be prepared to learn more about rates, unit rates, and solve real world rate problems.
Common Core Standard(s) in focus: 6.RP.3.a A video intended for math students in the 6th grade Recommended for students who are 11-12 years old
Transcript Reviewing Representations of Ratios
Segway Sam is visiting his favorite supermarket.
The free samples at the Steal-a-Deal market are incredible!
Sam never seems to buy anything and has a tendency to go a bit overboard with the free samples.
He decides to keep track of his calories while snacking using his new, fancy fitness watch.
Reviewing representations of ratios will help Sam keep his free-sample eating-habits in check.
Sam takes a good look at the cheese cubes.
His fancy fitness watch tells him the caloric content of the cheese in the form of a ratio.
3 cheese cubes are 15 calories.
We can write the ratio of cheese cubes to calories as 3 to 15 or in fraction form, 3 over 15.
We could also think about calories to cheese cubes instead, giving us an associated ratio 15 to 3 or in fraction form, 15 over 3.
We could also reduce these ratios to their unit rate: the ratios equivalent to these ones in which one of the terms is equal to one.
Here we have that the unit rate of 3 over 15 is 1 over 5, or 1 cube per 5 calories.
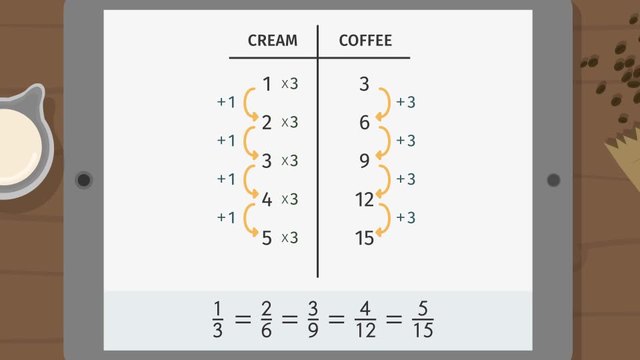
Determining Equivalent Ratios
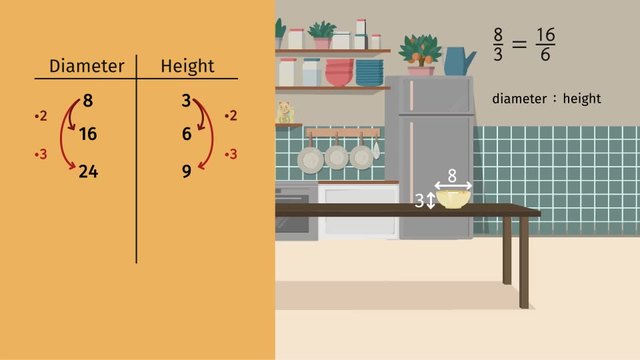
Ratio Tables - Additive and Multiplicative Structure
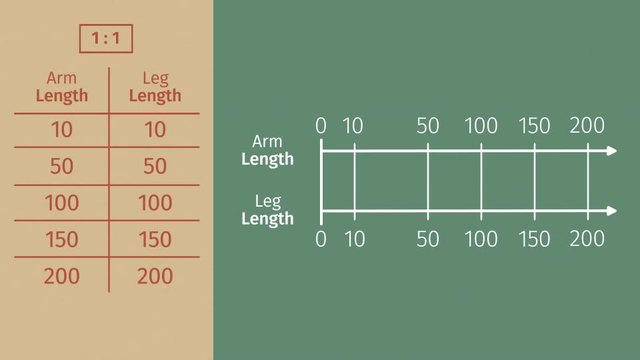
Comparing Ratios Using Ratio Tables
From Ratio Tables to Double Number Lines
From Ratio Tables to Equations

Plotting Ratios on the Coordinate Plane
Reviewing Representations of Ratios

What are Congruence and Similarity?


