Ratio Tables - Additive and Multiplicative Structure

Basics on the topic Ratio Tables - Additive and Multiplicative Structure
Introduction to Ratio Tables
Welcome to the world of ratio tables, a key concept in mathematics that helps us understand relationships between numbers. If you've ever wondered how to keep proportions consistent in a recipe or determine the number of items each person can receive in a group, ratio tables are your go-to tool.
Ratio tables not only assist in everyday situations but also lay the groundwork for more advanced math topics you'll encounter in the future. Let's get started on this mathematical journey!
Understanding Ratio Tables – Definition
A ratio table is a systematic way to list pairs of numbers that are in the same ratio. It's a simple but powerful tool that lets us visualize the proportional relationship between two quantities. Ratio tables are especially useful when scaling quantities up or down, maintaining the essence of the relationship intact.
For instance, if you're cooking and need to adjust a recipe for a different number of people, a ratio table can help you calculate the new amounts of ingredients you'll need. The rules are straightforward:
- Determine the initial ratio.
- Set up a table with two columns, one for each quantity.
- Fill in the table with pairs of numbers that maintain the ratio.
Ratio Tables – Example
Let's say a cookie recipe requires a ratio of 1 cup of sugar to 2 cups of flour. To make more cookies, we need to increase the quantities while maintaining the ratio. Here's how you can use a ratio table to adjust the recipe for different batches:
| Cups of Sugar | Cups of Flour |
|---|---|
| 1 | 2 |
| 2 | 4 |
| 3 | 6 |
| ... | ... |
If we wanted to triple the recipe, we would look at the third row, which shows we'd need 3 cups of sugar and 6 cups of flour.
Ratio Tables – Guided Practice
Try one more scenario.
Ratio Tables – Summary
Key Learnings from this Text:
- Ratio tables help us understand and maintain the relationship between two quantities.
- They are versatile tools that can be used in a variety of real-life scenarios, from cooking to budgeting.
- Recognizing and applying patterns in ratio tables can greatly simplify problem-solving.
- Attention to detail is crucial to avoid common mistakes when working with ratio tables.
Embrace the power of ratio tables to make your mathematical adventures easier and more accurate. If you enjoy exploring such useful concepts, check out other content on our website for interactive practice problems and resources!
Ratio Tables – Frequently Asked Questions
Transcript Ratio Tables - Additive and Multiplicative Structure
All summer long we've been baffled by the frozen brews Basti, the barista, has blended.
He's just about to add a new concoction to his board called the Berry Brew Blend and we want to know how he creates it.
Basti's refreshing brew mixes coffee with caramel, strawberries, and cream.
To be able to recreate Basti's blend, we should understand the additive and multiplicative structure of ratio tables.
A ratio table is a structured set of equivalent ratios.
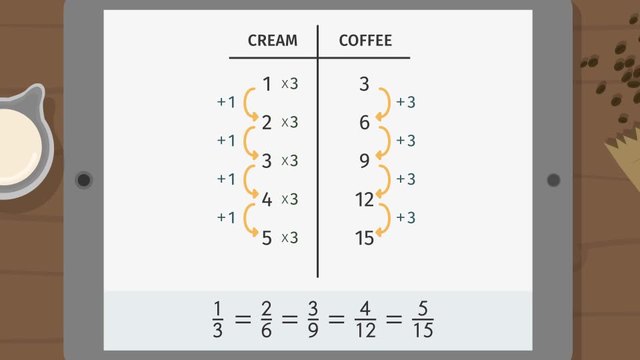
Let's examine this ratio table that Basti already has showing a 1 to 3 ratio of cream to coffee.
This means, for every 1 part cream, he needs 3 parts coffee.
What does that mean if he has 4 parts cream?
According to the table, he needs 12 parts coffee.
Can you describe any patterns you see in this ratio table?
Moving across the table, we always multiply by 3.
1 times 3 is 3, 2 times 3 is 6, and so on.
Notice that the ratios are equivalent and can be reduced to one third.
Let's move vertically down the table.
Every time we add one to the cream column, we add 3 to the coffee column.
Notice that ratio appears again: add 1, add 3. That's 1 to 3.
We're seeing that pattern a lot in this table.
So, what happens when a large order comes in for the Berry Brew Blend?
We'll need to help Basti build out his table.
Remember that 1 to 3 ratio
Adding the one vertically along this column and adding the 3 along the coffee column helps us complete the table.
We decided to use the additive structure along the columns, but using the multiplicative structure along the rows would still result in an equvailant ratio table.
The way you create your ratio tables is up to you just as long as the ratios are equivalent.
So now we can see for this large order if Basti uses 9 parts cream he needs 27 parts coffee.
That's a lot of coffee, but his concoction doesn't stop there.
It also includes caramels and strawberries.
For every 2.5 cubes of caramel Basti adds to his coffee creation, he blends in 10 frozen strawberries.
Yum!
Using the equivalent ratios 2.5 to 10, or 4 to 16, let's fill in the rest of the table.
The reduced ratio is 1 to 4.
Again, there are many ways to fill in this table.
We can use addition or multiplication, or both.
So how do we get from 2.5 caramels to 10 strawberries using multiplication?
We multiply by 4.
We can see that it works here: 2.5 times 4 is 10, and here: 4 times 4 is 16
We can use this multiplicative structure to complete the table.
5.5 times 4 is 22, 7 times 4 is 28, and 8.5 times 4 is 34.
We decided to use the multiplicative structure, but we could also use the additive structure.
To get from 2.5 to 4 we add 1.5 and from 10 to 16 we add 6.
We can see the addition of 1.5 works along the caramel column, and adding 6 along the strawberry column also matches our earlier information.
Also notice that this ratio of 1.5 to 6 simplifies to 1 to 4 as well.
Interesting.
To summarize what we've learned.
Ratio tables are a structured set of equivalent ratios.
There are lots of patterns in a ratio table.
We always add the same numbers down each column or multiply across the rows by the same multiplier.
You may have noticed the multiplier is the reciprocal of the simplified ratio. Neat, huh?
It's really up to you to decide which structure to use!
Let's reward ourselves for persevering through ratio tables.
Fortunately, Basti's just whipped up a new batch of his Berry Brew Blend for us to try.
Oh, be careful, Basti!
Ratio Tables - Additive and Multiplicative Structure exercise
-
Identify a pattern and apply it to a table of ratios.
HintsLook for patterns in the table to find the missing numbers. Looking in two directions is helpful, vertically and horizontally.
Looking at the ratio table, can you determine the difference between $7$ and $14$? What is the pattern?
SolutionThe table here shows the missing values. The pattern in the left column is added by 7. The pattern in the right column is added by 1. The ratio of Coffee to Chocolate is 7:1.
-
Determine the ratio for a given table of values.
HintsOne way to find the ratio is to see what the table's additive structure is. Look at the first column and see what each row is increasing by. Then look at the second column to see what each row is increasing by.
Notice in this table that the "cream" column is increasing by 1 and the "coffee" column is increasing by 3. The ratio of cream to coffee is $\frac{1}{3}$.
Remember to simplify all ratios.
The ratio $2:8$, or $\frac{2}{8}$ can be simplified by dividing the top and bottom by $2$.
$\frac{2}{8}=\frac{1}{4}$
SolutionTo find the ratio of $x$ to $y$, set them each up as a fraction comparing the two columns.
-
Apply the additive structure of ratio tables to extend the table.
HintsYou can use the additive property to add the same amount vertically to extend the table.
You can use the multiplicative property to multiply horizontally to extend the table.
The amount added each time for caramel is $1.5$ and for strawberries is $6$.
Solution$\begin{array}{|c|c|} \text{Caramel} & \text{Strawberries}\\ \hline 2.5 &10\\ 4&16\\ 5.5&22\\ 7&28\\ 8.5&34\\ 10&40\\ 11.5&46\\ 13&52\\ 14.5&58\\ \end{array}$
In the left column, add $1.5$ to $8.5$ to get $10$. Similarly, add $6$ to $34$ to get $40$ in the right column.
Continue this pattern by adding $1.5$ to $10$ in the left column to get $11.5$. Similarly, add $6$ to $40$ to get $46$ in the right column.
Continue this pattern by adding $1.5$ to $11.5$ in the left column to get $13$. Similarly, add $6$ to $46$ to get $52$ in the right column.
Continue this pattern by adding $1.5$ to $13$ in the left column to get $14.5$. Similarly, add $6$ to $52$ to get $58$ in the right column.
The multiplicative strategy can also be used to see the pattern between the Caramel and Strawberries. The caramel can be multiplied by $4$ to find out the quantity of strawberries.
-
Identify key features of a given ratio table.
HintsWhat it the pattern you notice in each column? What are the numbers increasing or decreasing by?
The multiplier is the reciprocal of the simplified ratio.
If the multiplier is $7$, the reciprocal is $\frac{1}{7}$
SolutionThe following statements are true regarding the famous chocolate milk recipe:
The ratio of the recipe is 1 part chocolate syrup for every 6 parts of milk.
The additive structure of this table is adding 1 in the chocolate syrup column, and adding 6 in the milk column.
The multiplicative structure of this table is $6$.
-
Identify a ratio in a table.
HintsThere are a few different ways to look at the table to find a pattern to help you determine the ratio. One way is to look horizontally and figure out the relationship between the syrup and coffee.
You will notice that the syrup values can all be multiplied by $8$ to find the amount of coffee.
You can also look at the table vertically to notice that the syrup column is increasing by 1, and the coffee column is increasing by 8.
The multiplicative structure is $8$. The additive structure is $\frac{1}{8}$.
If you notice these numbers are reciprocals.
SolutionThe ratio for the given table is $\frac{1}{8}$.
1 part peppermint syrup for every 8 parts of coffee.
-
Describe patterns in ratio tables.
HintsThe common ratio of cream to coffee is the simplest fraction with the amount of cream in the numerator and the amount of coffee in the denominator.
Make sure to put the amount of cream in the numerator and the amount of coffee in the denominator of the fraction.
Solution$\begin{array}{|c|c|} cream & coffee\\ 2.5 &1\\ 5&2\\ 7.5&3\\ 10&4\\ 12.5&5\\ \end{array}$
This ratio table has a pattern of adding $2.5$ in the left column and $1$ in the right column. This results in a common ratio of $5/2$ in simplest form. The multiplicative property shows that the value in the left column is multiplied by $0.4$ to get the value in the right column.
$\begin{array}{|c|c|} cream & coffee\\ 1 & 4\\ 2 & 8\\ 3&12\\ 4&16\\ 5&20\\ \end{array}$
This ratio table has a pattern of adding $1$ in the left column and $4$ in the right column. This results in a common ratio of $1/4$ in simplest form. The multiplicative property shows that the value in the left column is multiplied by $4$ to get the value in the right column.
$\begin{array}{|c|c|} cream & coffee\\ 1 & 1.5\\ 2 & 3\\ 3&4.5\\ 4&6\\ 5&7.5\\ \end{array}$
This ratio table has a pattern of adding $1$ in the left column and $1.5$ in the right column. This results in a common ratio of $2/3$ in simplest form. The multiplicative property shows that the value in the left column is multiplied by $1.5$ to get the value in the right column.
$\begin{array}{|c|c|} cream & coffee\\ 1 & 1\\ 2 & 2\\ 3&3\\ 4&4\\ 5&5\\ \end{array}$
This ratio table has a pattern of adding $1$ in the left column and $1$ in the right column. This results in a common ratio of $1$ in simplest form. The multiplicative property shows that the value in the left column is multiplied by $1$ to get the value in the right column.
Determining Equivalent Ratios

Ratio Tables - Additive and Multiplicative Structure
Comparing Ratios Using Ratio Tables
From Ratio Tables to Double Number Lines
From Ratio Tables to Equations

Plotting Ratios on the Coordinate Plane

Reviewing Representations of Ratios

What are Congruence and Similarity?


