Plotting Ratios on the Coordinate Plane


Basics on the topic Plotting Ratios on the Coordinate Plane
After this lesson, you will be able to take a ratio and represent it as a graph on the coordinate plane.
The lesson begins with an explanation of how to write a ratio as a proportion, then use substitution to create a ratio table. It then demonstrates how to use your ratio table to create a graph on the coordinate plane, and the difference between continuous and discrete sets of data.
Learn how to plot ratios on the coordinate plane by helping Valli get noticed at Hair Fashion Week in Paris!
This video includes key concepts, notation, and vocabulary such as: ratio (a comparative, proportional relationship between two amounts); equivalent ratios (two or more ratios which represent the same proportional relationship); ratio tables (a table of equivalent ratios); continuous data (data that can take any rational value, represented by a line on the coordinate plane); and discrete data (data that cannot be divided into smaller parts, represented by unconnected points on the coordinate plane).
Before watching this video, you should already be familiar with ratios, equivalent ratios, proportional relationships, and how to graph points on the coordinate plane.
After watching this video, you will be prepared to learn more about visual representations of ratios and the relationship between ratios and proportions.
Common Core Standard(s) in focus: 6.RP.A.3a A video intended for math students in the 6th grade Recommended for students who are 11-12 years old
Transcript Plotting Ratios on the Coordinate Plane
It’s hair fashion week, which means the world is holding its breath once again for the unveiling of the latest summer line by the hairdo artist known simply as Valli. Over the years, Valli has developed a huge fan following as well as a reputation for maintaining the pefect ratio of fun to class. To fully appreciate his signature look, critics recommend plotting ratios on the coordinate plane. Look at that! So bold! So daring! Valli’s signature hairstyles always maintain a consistent ratio of business length in the front to party length in the back. This year, that ratio is 2 to 5. So what if we want to use that information to predict some possible hairstyles that could show up in Valli's latest summer line? To do that, let's find an equation that will help us plot this ratio on the coordinate plane. We can start by writing the ratio of business, 'b', to party, 'p', as a proportion. Now, let's isolate the variables using cross multiplication and then divide both sides by 2, so that the 'p' is alone on one side of the equation. Using substitution, we can fill in this ratio table to predict a few different possible hairstyle lengths in Valli's summer line. For example, if we substitute 2 for 'b' we get 5 for 'p'. If we substitute in 4 for 'b,' 5 over 2 times 4 equals 10, so when 'p' is 4, 'b' is 10. We can continue this process of selecting a value for 'b,' inserting it into our equation and solving for 'p' until our table is full of equivalent ratios. But what if we want to predict ALL possible hairstyles in Valli's summer line? Well, we can start by graphing the points we know on the coordinate plane. Now, ask yourself the question, could a hairstyle be 3 and a half inches long? What about 5 and three-quarters? Because hair can be any length we could imagine, we connect the plotted points with a straight line. This shows that the coordinates of any point on this line will have a ratio of 2 to 5. This kind of data is called continous, because it can take any rational value. Can you think of other data that is continuous? Length, distance, and time are all common forms of continuous data. Valli has another super-hot item in his summer lineup this year. Moustaches are BACK! But it looks like not everyone got the memo. For every 3 moustaches, there is one person with no moustache. Let's use this information to predict how many people are not keeping up with the trend. We can use what we know to write the proportion of Stash, 's,' to 'No Stash', 'n,' as 3 to 1. Just like we did before, we can use cross-multiplication to isolate the variables. Then, since we want to predict the number of people with NO moustache, multiply both sides by one-third. Now, we can substitute in any number of moustaches for the variable 's' and get a corresponding value for 'n'. For example, if there are 3 people with a stash, then you have 1 with no stash. If we have 6 people with moustaches, then there are 2 without. And if we have 12 people with moustaches, then there are 4 people who are totally missing the trend. Just like before, plot this information on the coordinate plane. Now, can we connect these points with a line to predict all possible ratios of moustache to no moustache? Well, ask yourself: can you have half a moustache? What about one-tenth of a moustache? While stashes indeed come in all shapes and sizes, either you have one or you don't. Even half a moustache is equal to one weird moustache. We call this type of data 'discrete.' Discrete data is the opposite of continuous, which means it can be counted and cannot be divided up into smaller parts. This kind of data is represented by points on the coordinate plane which are not connected by a line. Other examples of discrete data are number of people, or the number of reviews Valli will read in tomorrow's fashion blogs. Speaking of reviews... Plotting a ratio on the coordinate plane is a great way to predict all possible equivalent ratios. We can do that by setting up a proportion, isolating one of the variables, then solving for that variable with substitution. After plotting your points on the coordinate plane, decide if your data is continuous. Ask yourself: "Could I substitute any rational value into this equation and get an answer that makes sense?" If yes, then connect your points with a straight line. If not, then your points represent discrete data and should remain unconnected points on the coordinate plane. As expected, Valli’s new style is the runaway hit of hair fashion week…but where will he go from here? Party in the front, and business in the back? Unbelievable!
Determining Equivalent Ratios
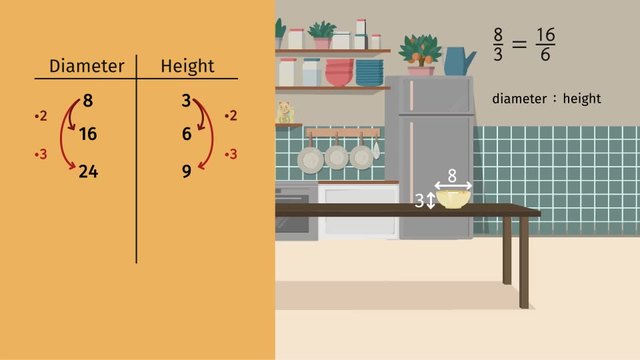
Ratio Tables - Additive and Multiplicative Structure
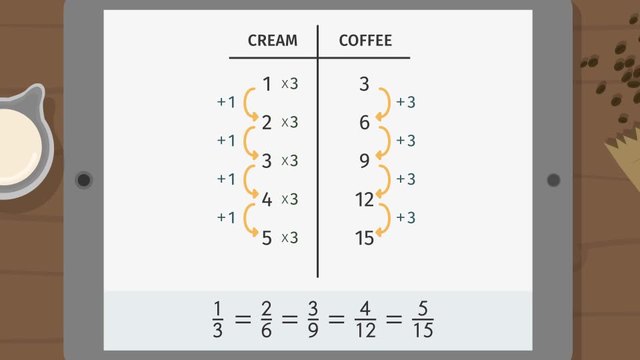
Comparing Ratios Using Ratio Tables
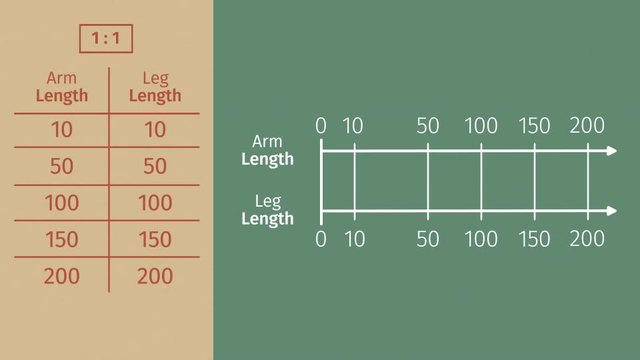
From Ratio Tables to Double Number Lines
From Ratio Tables to Equations
Plotting Ratios on the Coordinate Plane

Reviewing Representations of Ratios

What are Congruence and Similarity?


