Graphing Linear Equations


Basics on the topic Graphing Linear Equations
Understand how to use the slope-intercept form can help you to become an expert at graphing linear equations. Also, just by looking at the line, you’ll be able to write an equation in slope-intercept form and then manipulate the equation to present it in whichever form your teacher has instructed.
The slope-intercept form is y = mx + b. The b-value is the y-intercept – the point where the line touches the y-axis and where x = 0. From this point on the line, you can use the m-value to write other points on the line. The m-value, the coefficient to the x-value, is the slope. After using rise over run to draw in several other points, connect the dots, and you have a line.
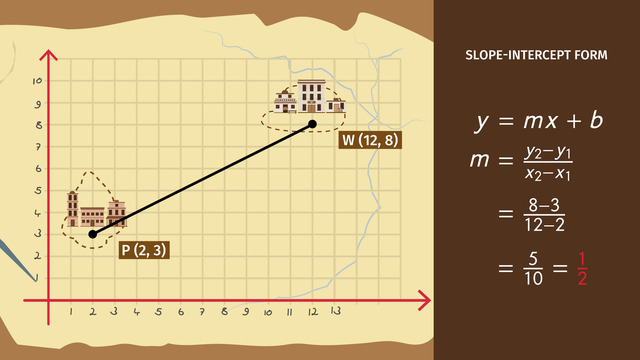
The reverse of this is write an equation of the line in slope-intercept by using a couple points on the line. To determine the b-value, look to see where the line touches the y-axis. This is the b-value. Next, select another point on the line and by drawing in a triangle, figure out the rise over the run which is the slope, the m-value. Remember if the line slopes down, the m-value is negative and if it slopes up, it is positive. If there the line is horizontal, the equation is y = c, and if the line is vertical, the equation is x = c.
To learn more about graphing linear equations, watch this video.
Write equations of the line.
CCSS.MATH.CONTENT.HSG.GPE.B.5
Transcript Graphing Linear Equations
Dr. Evil is in his elegant lair busily hatching another especially evil plot. This time, he’s after some information stored on General Good’s computer. To steal the data, he plans to use C.H.E.E.S.E.1, a computer hacking drone.
Before Dr. Evil can launch his plan, there are some problems he must solve. C.H.E.E.S.E.1 can copy data at a speed of one point two-five petabytes per second.
Dr. Evil has been surveilling General Good and knows that every day, exactly at midnight, General Good opens the window and goes into the hallway to stretch for 60 seconds. So the drone will have just sixty seconds to download all of the data. The problem is, can C.H.E.E.S.E.1 complete the task in time?
Writing the Linear Equation in Slope-Intercept Form
You may ask, how can Dr. Evil solve this problem? He can graph linear equations using slope-intercept form. Let’s take a look at the coordinate system.
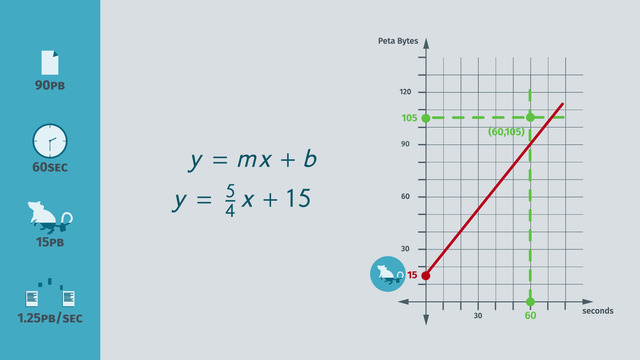
The file he plans to steal is ninety petabytes. The drone has exactly sixty seconds to copy all of the data and the hacking program loaded on C.H.E.E.S.E.1 takes up 15 petabytes of space. The drone will have a total of 105 petabytes of data after copying the wanted files, if the caper is successful.
Now, he writes the equation in slope-intercept form: y = mx + b. Remember, m = slope and b = y-intercept. For this equation, x represents the number of seconds it takes for the drone to download the data and y represents the total amount of data stored on the drone.
The drone can download 1.25 petabytes of data per second, so the coefficient – or the slope – of x is 1.25.
The hacking program loaded on C.H.E.E.S.E.1 takes up 15 petabytes of space. Since this number does not change, it's called a constant. It is also the y-intercept.
Putting all of this together, the equation in slope-intercept form is y = 1.25x + 15.
Graphing the Linear Equation
Dr. Evil graphs the equation. The line touches the y-axis at the y-intercept, 15. The slope is 1.25. To graph this, write this decimal as a fraction. So the slope is 5/4, which means that the line rises 5 and runs 4. Dr.
Evil needs to know if C.H.E.E.S.E.1 do the task. Oh no! The line doesn’t go through the ordered pair of (60, 105) representing sixty seconds and 105 petabytes, respectively.
C.H.E.E.S.E.1 is too slow. What can Dr. Evil do? Dr. Evil has a plan B. He can use MAC2, a faster version. It’s a bit of a risk cause MAC2 is a beta version, but Dr. Evil is desperate. MAC2 has a download speed of one point 75 petabytes per second.
Using the download speed for MAC2, Dr. Evil writes a new equation in slope-intercept form. This time, the x coefficient, or slope, is equal to 1.75. The y-intercept does not change.
Dr. Evil gathers his evil data and draws an evil graph. The line still touches the y-axis at 15, but since the slope is 1.75 or 7 over 4 in fraction form, the line rises 7 and runs 4.
The graph indicates MAC2 can download 120 petabytes of data in sixty seconds. Dr. Evil is ecstatic! The graph shows MAC2 can do the task with seconds to spare!
Dr. Evil can’t wait to take a look at the data stolen from General Good. Oh no! What’s this? MAC2 copied the wrong file. Now, Dr. Evil’s computer is infected with the Kitty Cat virus. Meow!
Graphing Linear Equations exercise
-
Describe how to solve linear equations by graphing.
HintsThe y-intercept doesn't depend on the variable $x$.
The slope represents the change depending on the time.
Depending on the time the drone can download a certain amount of data.
SolutionDr. Evil wants to write the problem as a linear equation in slope-intercept form:
$y=mx+b$, where $m$ is the slope and $b$ is the y-intercept.
What do we know?
- We know the download rate of the drone is $1.25~PB$ per second. This is the slope $m$.
- We also know the amount of storage space used for the hacking program is $15~PB$. This amount of space is independent of the time and is the y-intercept.
$y=1.25x+15$.
From the graph, you can see the drone C.H.E.E.S.E. 1 won't be able to download the entire amount data in the allotted amount of time.
-
Does MAC2 have time enough to copy all the data?
HintsThe slope-intercept form is:
$y=mx+b$.
$m$ is the slope and $b$ is the y-intercept. In this case:
$y=1.75x+15$.
In order to draw the graph of a linear equation, you need to find the y-intercept first.
In this case the slope is $m=1.75=\frac74$. This means to run four and rise seven.
Determine the y-value for $x=60$.
SolutionWrite an equation in slope-intercept form:
$y=mx+b$
For this situation, $m$ corresponds with the rate of copied data per second:
$m=1.75=\frac74$
$b$ corresponds with the required storage independent of time:
$b=15$
$y=1.75\times 60+15=120$.
First we mark a point at the y-intercept ($b=15$) then move four to the right and rise seven - mark this point then draw a line to connect the two points.
As you can see, the graph reflects the information for this situation written in slope-intercept form.
At 60 seconds, the y-value is more than $105~PB$ ($90~PB$ of copied data + $15~PB$ of internal storage used for the hacking program).
Therefore MAC 2 can successfully copy the full amount of data.
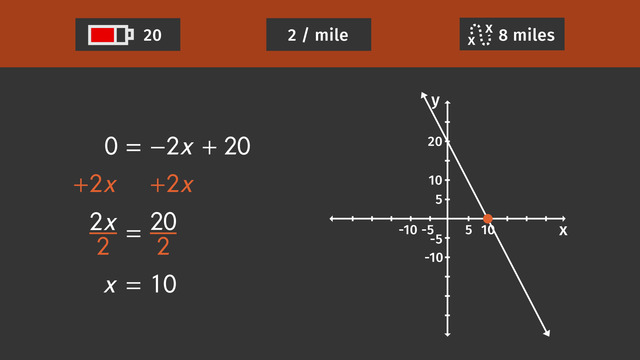
-
Examine if C.H.E.E.S.E. 1 succeeds at getting $8~oz$ of cheese for Dr. Evil.
HintsTo calculate $b$, plug $x=0$ into $y=mx+b$.
Keep in mind that the amount of cheese needed from the drone has a negative impact.
The drone succeeds in getting more than 8 oz of cheese.
SolutionFor this problem, Dr. Evil has to set up a linear equation written in slope-intercept form: $y=mx+b$.
- $m$ is the slope
- $b$ is the y-intercept
$b=-0.4$
Now we still have to determine the slope - the rate of cheese per minute:
$m=0.3$
The line written in slope-intercept form:
$y=0.3x-0.4$
In order to find out whether C.H.E.E.S.E. 1 will succeed in getting 8 oz we still have to plug in the time $x=30$:
$0.3\times30-0.4=9-0.4=8.6$.
Great: the brunch is saved.
-
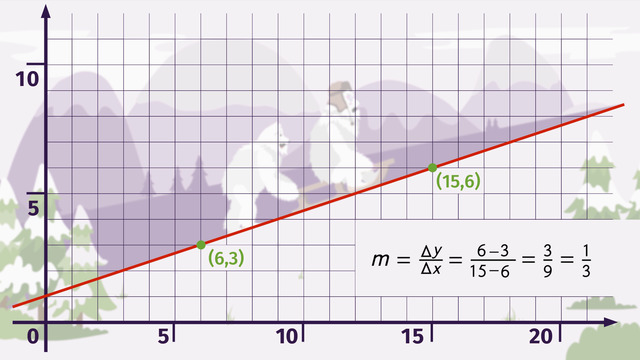
Determine the linear equation.
HintsYou will find the y-intercept at the point where the line crosses the y-axis.
The slope is equal to the change in $y$ divided by the change in $x$.
SolutionThe y-intercept is quite easy to find. It is the point where the line crosses the y-axis:
$b=-3$
The slope is equal to the rise over the run.
- rise: two steps up
- run: one step to the right
The information written as a linear equation in slope-intercept form:
$y=2x-3$
Let's check this equation. We can see on the right side, that the x-intercept is given by $x=1.5$.
Now we plug in this value into the equation: $y=2\times 1.5-3=3-3=0$ $\surd$.
-
Identify the different parts of the graph and the equation.
HintsRemember the slope intercept form for linear equations:
$y=mx+b$
If you substitute $x$ with zero we get:
$y=m\cdot 0+b=b$
This the point, where the line intercepts the y-axis, the y-intercept.
You can also remember the slope as rise over run.
SolutionRemember how to write a linear equation in slope-intercept form:
$y=mx+b$.
- The factor $m$ is the slope.
- The term $b$ is the y-intercept.
- The slope is $m=1.25$.
- The y-intercept is $b=15$.
To draw the slope it`s better to change a decimal into a fraction:
$1.25=\large{\frac{125}{100}}=\large{\frac{5}{4}}$
-
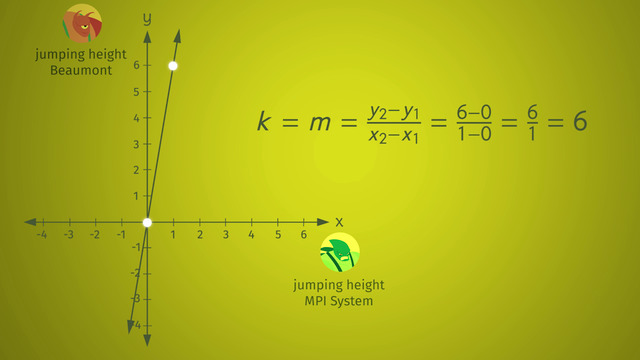
Decide which equation belongs to which graph.
HintsEach equation is written as a linear equation in slope-intercept form:
$y=mx+b$.
The y-intercept is easy to find. It is the point where the line crosses the y-axis.
The slope is equal to the rise over the run.
- The rise goes up or down.
- The run goes to the right or to the left.
SolutionEach equation is written in slope-intercept form $y=mx+b$.
The blue line as well as the green line have the same y-intercept:
$b=3$
The yellow line as well as the red line have the same y-intercept:
$b=-1$
Now we determine the slope for each line:
The red line rises one step and runs four steps to the right. This results in $m=\frac14=0.25$. We can write the equation:
$y=0.25x-1$
$~$
The yellow line rises one step and runs one step to the right. This results in $m=\frac11=1$. We can write the equation:
$y=x-1$
$~$
The green line rises one step and runs four steps to the right. This results in $m=\frac14=0.25$. We can write the equation:
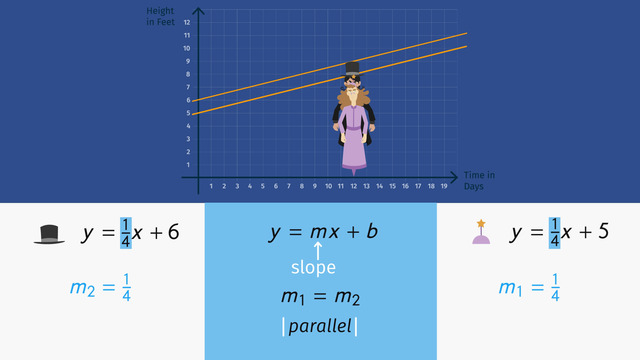
$y=0.25x+3$ This line has the same slope as the red one. These lines are parallel.
$~$
The blue line rises one step and runs two steps to the right. This results in $m=\frac12=0.5$. We can write the equation:
$y=0.5x+3$


Hi Jallah K B. We had some technical problems during the first days. Everything should work now. Hope you enjoy learning with sofatutor.
Best wishes
Julia
The homework chat has been unavailable since I registered. What is going on?