Visualizing the Percent of a Quantity
- Visualizing the Percent of a Quantity – Definition
- Visualizing the Percent of a Quantity – Explanation
- Visualizing the Percent of a Quantity – Example
- Visualizing the Percent of a Quantity – Practice
- Visualizing the Percent of a Quantity – Summary
- Visualizing the Percent of a Quantity – Frequently Asked Questions


Basics on the topic Visualizing the Percent of a Quantity
Visualizing the Percent of a Quantity – Definition
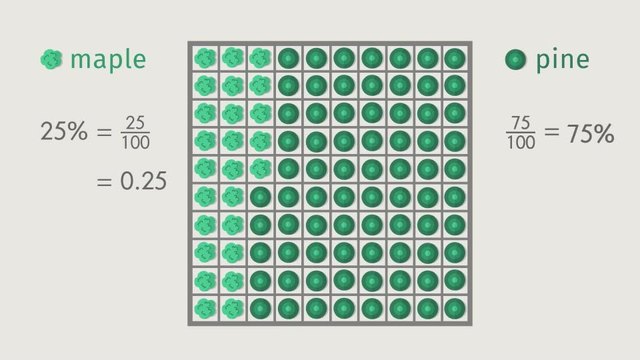
When we talk about percentages, we are discussing a way to express a number as a fraction of 100. This is extremely useful in everyday life, such as calculating sales tax, determining a discount during shopping, or figuring out what portion of a class voted for a certain option.
Percent is derived from the Latin phrase per centum, which means per hundred. In mathematics, it is represented by the symbol %.
Visualizing the Percent of a Quantity – Explanation
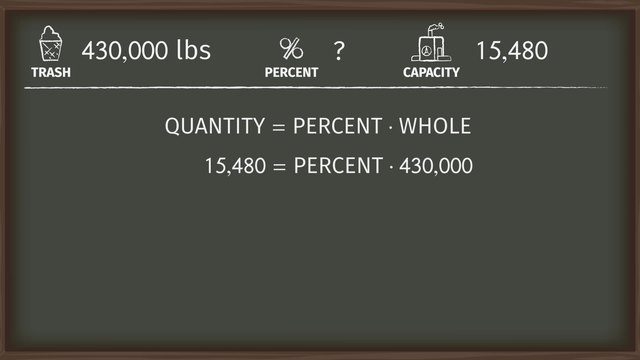
The fundamental concept of a percent is that it represents a part of a whole divided into 100 equal parts. Understanding how to write a fraction as a percent can be very helpful when solving problems in the world. The formula that connects parts, wholes, and percentages is:
| Term | Definition |
|---|---|
| Part | The segment or portion of the total quantity that is being considered. |
| Whole | The total or complete quantity of something. |
| Percent | A ratio or fraction that represents a number as parts per hundred. |
This formula helps us find missing values when two of the three are known.
Visualizing the Percent of a Quantity – Example
Let's explore how this concept is applied with a real-world example:
Example 1: Imagine you have a pizza divided into 10 equal slices, and you eat 2 slices. What percent of the pizza did you eat?
Example 2: Imagine you took a quiz that had 20 questions, and you answered 15 of them correctly. What percent of the questions did you get right?
Example 3: Imagine a water tank that can hold 50 liters of water. If there are currently 30 liters of water in the tank, what percent of the tank is full?
Visualizing the Percent of a Quantity – Practice
Practice visualizing a percent and representing a fraction as a percentage.
Visualizing the Percent of a Quantity – Summary
Key Learnings from this Text:
A percent represents a fraction of 100.
The formula $\text{Part} \div \text{Whole} = \frac{\text{Percent}}{100}$ is essential for solving problems involving percentages.
Visual representations, like the pizza example, can help solidify understanding of percentages.
Visualizing the Percent of a Quantity – Frequently Asked Questions
Transcript Visualizing the Percent of a Quantity
Every night, three brother raccoons go out grocery shopping. Butch, Bailey, and Bonsai are very picky eaters. They have strict rules about what they will and will not eat. To correctly sort their, uh, groceries, the brothers use models and diagrams to visualize the percent of a quantity. After their shopping spree, the brothers dump out their bounty and start sorting! Butch has a sweet tooth and only eats sugary foods. He collected 60 items total, and 18 of these items are sweet. What percent of his items will he eat? This problem contains three components: the whole, the part, and the percent. If you know two out of three of these components, you can always find the third. The 60 items Butch collected are "the whole" in this problem. That's the total number of items. 18 of these items are sweet. Those 18 items are "the part". So what is a percent? A percent is what the part would be if the whole were 100. It's an equivalent ratio to part over whole, where the numerator is the percent and the denominator is 100. In this problem, the part and whole are known, and the percent is unknown. Let's use a double number line to visualize and find the percent. A double number line shows a series of pairs that all have the same ratio. The bottom number line will represent the "whole" and the top number line will represent the "part". We want to know the part when the whole is 100. That will give us our percent. First we count on the bottom number line, from 0 to 100, by an increment that will have 60, as well as 100, as a multiple. Let's count the bottom number line by increments of 20, since 60, as well as 100, are multiples of 20. We could have also chosen to count by increments of 10, or 5, as well. We know that when the whole is equal to 60 that the part is equal to 18, and that when the whole is equal to 0 that the part is also equal to 0. We must count on the top number line by an increment which has 18 as a multiple. Since there are three intervals before 18, we divide 18 by 3 to get that each interval should increase by 6 on the top number line. So we count on the top number line by increments of 6. Looks like there are 30 parts per 100, or 30 percent. That means 30 percent of Butch's items are sweet. Sugar overload! The second brother, Bailey, only eats red foods. Bailey collected 40 items, and 30 percent of them are red. Again, we have two components, and we can find the third. We know the whole: 40 items. And we know the percent: 30 percent. What's missing? The part. The part in this problem is how many of Bailey's items are red. We can visualize this problem using a 10 by 10 grid that represents the whole. Let's divide up our 40 items evenly among the 100 squares in this grid. We can determine how many items one square gets by dividing 40 by 100. Doing this, we see that one square gets .4 of an item. As there are 100 squares in this grid, 30 squares of the grid represent 30 parts per 100, or 30 percent. Now we can find the part. How many items are there in total in these 30 squares? We see that adding the items in these 30 squares together, or calculating 30 times .4, gives us 12 items total. So now we know that 12 out of 40 of Bailey's items are red. Bonsai is a vegan. He won't eat any animal products, not even leather shoes! 70% of what Bonsai collected is vegan, and he has 14 vegan items. In this problem, we know the percent, 70%, and the part, 14 vegan items. Looks like Bonsai forgot how many items he collected in the first place! Don't worry, Bonsai! Because we know the values of two of the quantities, we can find the third, the whole. Let's use a tape diagram to visualize this problem. We draw a piece of tape, and we would like to split it up into evenly sized pieces. In general we can split up our piece of tape anyway we choose, as long as it is split into evenly sized pieces. In our case, let's choose to split our piece of tape into 10 pieces, each piece representing 10 percent. Then we shade in 7 pieces of our tape to represent 70 percent. This shaded section of the tape represents Bonsai's 14 vegan items. So how many items does each piece of tape represent? 14 items divided evenly into 7 pieces means 2 items per piece. Counting up all the items in each piece, we see that all 10 pieces together represent a total of 20 items. That's the whole. So Bonsai collected a total of 20 items! We have seen that percent problems deal with three quantities: the part, the whole, and the percent. And if we know two of the three quantities, then we can solve for the last. We can use visual tools, like double number lines, 10 by 10 grids, and tape diagrams to help visualize and solve percent problems. Use the one that makes the most sense to you! Oh, Looks like Bonsai collected a red, vegan, sweet caramel apple! Oh no...
Visualizing the Percent of a Quantity exercise
-
Find the missing percent using the double number line.
HintsThe percent is what the part would be if the whole were $100$.
This is represented by the proportion, $\frac{\text{Percent}}{100}=\frac{\text{Part}}{\text{Whole}}$.
Since there are $3$ increments on the top line before $12$ (including zero), divide $12$ by $3$ to find the distance between the increments.
The percent is the number at the increment that matches with $100$.
SolutionThe percent is what the part would be if the whole were $100$.
This is represented by the proportion, $\frac{\text{Percent}}{100}=\frac{\text{Part}}{\text{Whole}}$.
Using the double number to figure out the equivalent ratios, find the increments on the top line.
Since there are $3$ increments before $12$, divide $12$ by $3$ to find that the distance between the increments is 4.
Therefore, the top line increments are $0$, $4$, $8$, $12$, $16$, $20$.
Since $20$ matches with $100$, there are $20$ parts per $100$ or $20\%$.
-
Complete the 10x10 grid.
HintsThere are $100$ squares in a $10\text{x}10$ grid which represents the whole.
A percent means parts per $100$. For example, $20\%$ is $20$ parts per $100$.
The $10\text{x}10$ grid on the right shows $10$ parts per $100$ or $10\%$.
Make sure you when you highlight, you start with the TOP ROW.
SolutionBonsai found $30$ items and $60\%$ are healthy.
We know the whole is $30$, the percent is $60$, but the part is missing.
The part in this problem is the number of items that are healthy.
We can visualize this situation using a $10\text{x}10$ grid which represents the whole.
Since there are $100$ squares in the grid, $60$ squares of the grid represent $60$ parts per $100$, or $60\%$.
We can determine how many items one square gets by dividing the total number of items, $30$, by $100$.
- $\frac{30}{100}=0.3$
Now we can find the part by adding the items in these $60$ squares together or calculating $60$ times $0.3$.
- $60(0.3)=18$
-
Complete the tape diagram.
HintsThere are $10$ evenly sized pieces in the tape diagram and each piece represents $10\%$.
A percent means parts per $100$. For example, $70\%$ is $70$ parts per $100$.
Since each piece represents $10\%$, this tape diagram represents $20\%$.
SolutionGiven the percent and part, a tape diagram can be used to find the whole by splitting it up into evenly sized pieces.
There are $10$ evenly sized pieces in the tape diagram and each piece represents $10\%$.
Shade $5$ pieces in the tape diagram to represent $50\%$.
This shaded section represents $22$ items.
To find the number of items each piece represents, divide $22$ by $5$.
- $\frac{22}{5}=4.4$
Counting up all of the items in each piece, we see that all $10$ pieces represents a total of $44$ items.
- $10(4.4)=44$
-
Interpret the diagrams.
HintsIn a double number line, the top line represents part and the bottom line represents whole. The percent is what the part would be if the whole were $100$.
In the tape diagrams, each piece represents $10\%$.
The $10\text{x}10$ grids represent the whole and each white box represents the part. The percent is what the part would be if the whole were $100$.
This diagram represents $30\%$.
SolutionDouble Number Lines
- In a double-number line, the top line represents the part and the bottom line represents the whole. The percent is what the part would be if the whole were $100$.
- The first double number line represents $75\%$ since $75$ on the top line corresponds with $100$ on the bottom line.
- The second double number line represents $40\%$ since $40$ on the top line corresponds with $100$ on the bottom line.
- In the tape diagrams, each piece represents $10\%$
- The first tape diagram represents $50\%$ since there are $5$ shaded blocks.
- The second tape diagram represents $80\%$ since there are $8$ shaded blocks.
- The $10\text{x}10$ grids represent the whole and each shaded box represents the part. The percent is what the part would be if the whole were $100$.
- Since there are $55$ shaded blocks in the first grid, the percent is $55\%$.
- Since there are $65$ shaded blocks in the second grid, the percent is $65\%$.
-
Identify the equation representing a percent.
HintsThe equation shows two equivalent ratios. The percent is what the part would be if the whole were $100$.
One ratio represents percent and the other represents the part to the whole.
In the following equation, $20$ represents the percent: $\frac{20}{100}=\frac{5}{25}$
SolutionThe equation shows two equivalent ratios:
- $\frac{\text{Percent}}{100}=\frac{\text{Part}}{\text{Whole}}$
-
Solve the word problems using a diagram.
HintsFor the first word problem, each square in the 10x10 grid represents $0.32$ because $\frac{32\text{ items}}{100\text{ squares}}=0.32$.
For the second word problem, there are increments of $20$ on the bottom line from $0$ to $100$. If $40$ students is $100\%$, divide $40$ by $5$ to fill in the missing increments on the top row. This will help you find the solution.
For the third word problem, the tape diagram can be split up into $4$ blocks each representing $25\%$.
Solution1. Last year, the Fighting Bees soccer team won $75\%$ of their games. The team played a total of $32$ games. How many games did they win?
Use a $10\text{x}10$ grid to help you answer the problem.
- Since the team won $75\%$, fill in $75$ out of $100$ squares.
- Each square represents $0.32$ because $\frac{32\text{ items}}{100\text{ squares}}=0.32$.
- Multiply $0.32$ by $75$ to find the number of games that the soccer team won.
- $0.32(75)=24$
- Therefore, the Fighting Bees soccer team won $24$ games last year.
Use a double-number line to help you answer the problem.
- In the double number line, the top line represents the part and the bottom line represents the whole.
- In this word problem, the part is the number of students that participated from Mrs. Matthew's class, and the whole is the total number of students that competed in the tournament.
- The increments on the bottom line are $0, 20, 40, 60, 80, 100$.
- The increments on the top line are $0, 8, 16, 24, 32, 40$.
- Since the percent is what the part would be if the whole were $100$, the percent is $30\%$.
Use a tape diagram to help you answer the problem.
- Split the piece of tape into $4$ pieces, each representing $15$ dollars and $25\%$.
- Counting up all the items in the $4$ pieces, $15+15+15+15=60$, means that the original price was $60$ dollars.