Percent and Parts Per 100


Basics on the topic Percent and Parts Per 100
After this lesson, you will be able to understand percent and illustrate percent through hundredths charts and tape diagrams.
The lesson begins by teaching how percent is a ratio of a part to a whole equal to 100. It leads you to learn how percent can be written as fractions or decimals. It concludes by showing how percent can be represented using hundreds charts and tape diagrams.
Learn about percent and parts per 100 by finding out how Busy Beavers Business plan to improve their business for the year.
This video includes key concepts, notation, and vocabulary such as ratio (a relationship between two non-zero quantities or numbers); hundreds chart (a grid chart with 10 rows and 10 columns) and tape diagram (a visual representation for a ratio).
Before watching this video, you should already be familiar with multiples, fractions, and decimals.
After watching this video, you will be prepared to represent real-life situations using percent and solve for missing quantities using visual representations.
Common Core Standard(s) in focus: 6.RP.A.3.C A video intended for math students in the 6th grade Recommended for students who are 11 - 12 years old
Transcript Percent and Parts Per 100
Justin, the big boss of the Busy Business Beavers, presents his plan for the upcoming year. The BBBs are a small, but growing company, and they hope to earn enough money to buy a bigger office dam. Justin is going on and on about his plan to grow trees by sowing seeds, and his two assistants, Dustin and Kevin, try to focus on what he says. In order to understand Justin's fail-proof business plan, they’ll need to understand percents and parts per 100. Justin starts by telling his employees about percents and their relationship to ratios. Let's look at the word percent. Cent is a word root that means one hundred. Per-cent is another way of saying parts per one hundred.
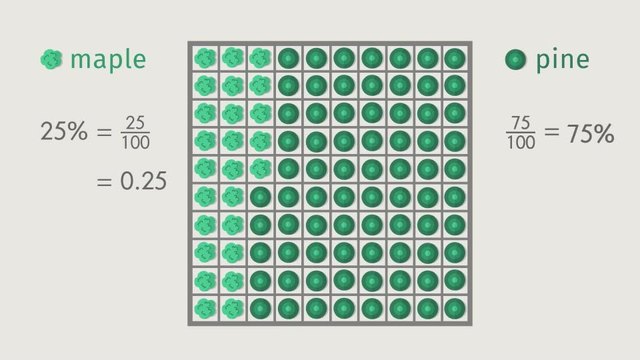
For example, let's look at 1 percent. That means it's 1 part per 100, which can be written as the fraction 1 over 100. This is equal to the decimal one hundredth. Justin tells the other beavers about the new plot of land they acquired, which has enough space to grow 10 rows of trees, with 10 trees in each row This looks just like a hundreds chart, which is a model that has ten rows and ten columns. That means there are 100 squares, making it perfect for modeling percents. The busy business beavers want to plant 25 percent maple trees. That means that we can look at the part as 25 and the whole as 100. It can be written as the fraction 25 over 100 or the decimal twenty-five hundredths In the hundreds chart, we can then put in 25 maple trees. The big boss says the remaining trees should be pine. Let's see what that looks like in the hundreds chart 75 trees out of 100 remain. That's the fraction 75 over 100, which gives us 75 percent or the decimal seventy-five hundredths. Adding the 25 maple trees to the 75 pine trees gives us 100 trees. Writing that as a fraction gives us 100 over 100, which is also equal to 100 percent and one whole. It looks like Dustin has something to say. Eh, it’s probably not important. So let’s get back to what Justin is saying. He’s talking about his plans for the trees they will chop down. For every tree they chop down, they will use 20 percent of the tree trunk for their new and bigger office dam, 70 percent to sell, and 10 percent to make skateboards. Justin uses a tape diagram to illustrate his plans. We know a whole log is equal to 100 percent, and a piece of tape represents 1 whole log. How are we going to divide up this tape diagram? Notice that each of the numbers is a multiple of 10 percent. If each part is 10 percent, then each amount will be represented by a whole number of tape pieces. We then divide 100 percent by 10 percent to get 10, which means that we will divide the tape into ten pieces. 20 percent is represented by these 2 parts of the tape, since 2 times 10 percent is equal to 20 percent. 70 percent is modeled by these 7 parts of the tape, and 10 percent is modeled by this last piece of tape. Altogether, that makes 100 percent, which is the same as one whole log. Let’s summarize. Hundreds charts and tape diagrams help us better visualize percents. With hundreds charts, each individual square represents one percent. For example, 15 percent is represented by 15 squares. 35 percent is represented by 35 squares. And 50 percent is represented by 50 squares. With a tape diagram, we divide the whole into equal parts. Depending on the percents, we divide it into different amounts. For example, we could divide it into 5 parts. 2 parts would be equal to 2 over 5, or 40 over 100. That would be equal to 40 percent. 3 parts would be equal to 3 over 5, or 60 over 100. That would be equal to 60 percent Justin and Kevin are confident in their fail-proof plan, but Dustin is still trying to get their attention about one little mistake in their plan unsuccessfully. Well, I guess you reap what you sow...
Percent and Parts Per 100 exercise
-
Identify the hundreds chart that would be equivalent to a given percentage.
HintsPercents are parts per one hundred.
The plot of land is a hundreds chart, which has one hundred squares total.
$12\%$ is the same as $\frac{12}{100}$. For $12\%$ of a hundreds chart to be shaded, $12$ of the $100$ squares would be shaded in.
How many of these squares would be shaded to represent 10%?
SolutionThis diagram shows 10%.
-
Describe why $1\%=\frac{1}{100}=0.01$.
HintsRelate percent to pennies. There are $100$ pennies in a dollar.
Fractions represent $\frac{\text{part}}{\text{whole}}$.
In place-value. The digit one place to right of the decimal point is the tenths place. The digit two places to the right of the decimal point is the hundredths place.
SolutionOne percent means one/$\bf{1}$ part per one hundred, which can be written as the fraction $\frac{1}{100}$. Remember that fractions are written as $\frac{\text{part}}{\text{whole}}$, so $1$ is the part and $100$ is the whole.
$~$
This fraction, in word form, is one-hundredth which is equal to the decimal $0.01$. In the decimal, the $1$ is in the hundredths place, so this decimal, in word form, is one-hundredth. Remember place value! The one is two digits to the right of the decimal point, this is the hundredths place.
$~$
All forms of $1\%$ show that you have $\bf{1}$/one out of the $100$ total parts. Therefore $1\%=\frac{1}{100}=0.01$.
-
Determine which percentages go with which model.
HintsPercent means per one hundred. When you have a hundreds chart, you can simply calculate how many total boxes are shaded.
For each model, write a fraction that represents the $\frac{\text{part}}{\text{whole}}$.
To change a fraction into a percent, make sure the denominator is $100$. $\frac{20}{100}=20\%$.
For example, if you have a tape diagram with $3$ out of $5$ boxes shaded, you can multiply the numerator and denominator both by $20$ to have a $100$ for the denominator.
$\frac{3\left(20\right)}{5\left(20\right)}=\frac{x}{100}$
$x$ is the value of the percent.
Solution- Tape Diagram with $5$ out of $10$ parts shaded in. This tape diagram can be represented as the fraction $\frac{5}{10}$. To change this fraction to a percent, we need the denominator to be equal to $100$. Multiply both the numerator and denominator by $10$ to get $\frac{50}{100}$. Percent means per $100$, so $\frac{50}{100}=50\%$. This tape diagram models $50\%$.
- Hundreds chart with $27$ of the $100$ spaces shaded in This hundreds chart can be represented as the fraction $\frac{27}{100}$, which is equal to $27\%$.
- Tape Diagram with $3$ out of $5$ parts shaded in This tape diagram can be represented by the fraction $\frac{3}{5}$. To change this fraction to a percent, we need the denominator to be equal to $100$. Multiply both the numerator and denominator by $20$ to get $\frac{60}{100}$. $\frac{60}{100}=60\%$, so this tape diagram models $60\%$.
- Hundreds chart with $75$ of the $100$ spaces shaded in This hundreds chart can be represented as the fraction $\frac{75}{100}$, which is equal to $75\%$.
- Hundreds chart with $30$ of the $100$ spaces shaded in This hundreds chart can be represented as the fraction $\frac{30}{100}$, which is equal to $30\%$.
-
Identify the part.
HintsPercent means per one hundred. If there are $100$ total squares and $40$ shaded, the value is $40\%$.
If there is a tape diagram, you will usually need to scale up to find the percent out of $100$.
For example, there are $2$ boxes shaded out of $4$ total. This can be written as $\frac{2}{4}$. To scale the denominator up to $100$, $4$ can be multiplied by $25$. Anything done to the denominator, must also be done to the numerator, so we also multiply $2$ by $25$.
$\frac{2\left(\times 25\right)}{4\left(\times 25\right)}=\frac{\%}{100}$
The value of $x$ is the percent.
Solution- Hundreds chart with $80$ of the $100$ spaces shaded in This hundreds chart can be represented as the fraction $\frac{80}{100}$, which is equal to $80\%$. (Solution pictured)
- Tape Diagram with $4$ out of $10$ parts shaded in. This tape diagram can be represented as the fraction $\frac{4}{10}$. To change this fraction to a percent, we need the denominator to be equal to $100$. Multiply both the numerator and denominator by $10$ to get $\frac{40}{100}$. Percent means per $100$, so $\frac{40}{100}=40\%$. This tape diagram models $40\%$. (Solution pictured)
- Tape Diagram with $1$ out of $4$ parts shaded in This tape diagram can be represented by the fraction $\frac{1}{4}$. To change this fraction to a percent, we need the denominator to be equal to $100$. Multiply both the numerator and denominator by $25$ to get $\frac{25}{100}$. $\frac{25}{100}=25\%$, so this tape diagram models $25\%$.
- Hundreds chart with $95$ of the $100$ spaces shaded in This hundreds chart can be represented as the fraction $\frac{95}{100}$, which is equal to $95\%$.
-
Complete the tape diagram.
HintsA tape diagram divides a whole ($100\%$) into equal parts.
The tape diagram can be split into 10 equally sized boxes, each worth 10%.
If the first box is equal to 10% which represents the flowers, how many boxes would need to be shaded in for the maple tree and the pine tree?
Solution- Flowers: $10\% = 10\%\times 1$, so $1$ of the $10$ spaces should be highlighted for flowers. This should be the first space.
- Maple Trees: $30\% = 10\%\times 3$, so $3$ of the $10$ spaces should be highlighted for Maples Trees. This should be the next three spaces to the right of the space highlighted for Flowers.
- Pine Trees: $60\% = 10\%\times 6$, so $6$ of the $10$ spaces should be highlighted for Pine Trees. This should be the remaining $6$ spaces in the tape diagram.
Together $10\% + 30\% + 60\% = 100\%$, so in the end the entire tape diagram should be highlighted
-
Solve the percentage problem.
HintsPercents can be displayed using a hundreds chart. The number shaded represents the percentage since this number is the part of the whole which is 100.
Percent is $\frac{\text{part}}{\text{whole}}$.
All percentages are out of 100.
If the denominator of a fraction is 100, then the numerator is the percentage.
Percents can be represented with a tape diagram. The number of boxes the tape is split into is equal in value and must total 100%.
In this tape diagram here, we have 5 equal sections. $100 \div 5 = 20$, so each box is worth 20. What is the percent represented with this tape diagram?
SolutionThe plots of land are listed here from least to greatest.
- Julie: Two of five boxes are shaded. $\frac{2}{5}$ is equal to $\bf{40\%}$
- Javier: There are 41 boxes shaded of the 100 total boxes. This is equal to $\bf{41\%}$.
- Jason: $\frac{42}{100}$ is equal to $\bf{42\%}$.
- Jayla: One of two boxes is shaded. $\frac{1}{2}$ is equal to $\bf{50\%}$