Stem and Leaf Plots


Basics on the topic Stem and Leaf Plots
A stem and leaf plot is a two-column diagram that organizes a given set of data and shows its frequency distribution. Each data point in a given data set is split into a stem and a leaf. The stem of a data point is all but the right-most digit of that data point, while its leaf is just its right-most digit. Data points with the same stem are grouped together and are individually marked in the stem and leaf plot by listing each of their leafs alongside their corresponding stem.
To make a stem and leaf plot, draw a table with two columns. In the left column, make a list of the distinct stem values which appear in the data set from least to greatest. Then list in the right column the leaves which appear for each stem in increasing order. Repetition of leaf values may occur if a certain data point appears more than once. This means that the number of entries in the given data set determine the number of leaves.
Stem and leaf plots are a convenient way to look at raw data since they allow us to display and analyze data at the same time.
Summarize and describe distributions.
CCSS.MATH.CONTENT.6.SP.B.4
Transcript Stem and Leaf Plots
Buford the Bee Keeper competes in the annual Honey Production Competition. He wins the competition every year, so you'd think he’d be certain of a win this year too, but the bees've been buzzing with complaints about the working conditions, so he's not so sure.
The rules for the competition are pretty simple: each beekeeper enters 10 beehives and at least 3 of the hives must produce at least 30 pounds of honey annually. The data is presented in a stem-and-leaf plots.
Creating a stem-and-leaf plots
An advantage of stem-and-leaf plots is they are quick to make, and each data point is displayed. Let's have a look.
Using the numbers in this data set, first identify the smallest and largest numbers, or the minimum and maximum numbers, respectively. Then, create the stem, a vertical column listing the digits of each number excluding the rightmost digit. In this case, the whole parts of each number make up our stem. For the stem, don't list any repeats.
Next, create the leaves. In ascending order, list the digit in the ones place for each data point. For the leaves, repeating digits are allowed, so add a leaf for every data point. To double check that you listed all the data points, count the number of entries. There are 8 numbers in this data set, so there should be 8 leaves listed in the plot. A key is useful to help interpret the chart.
Example
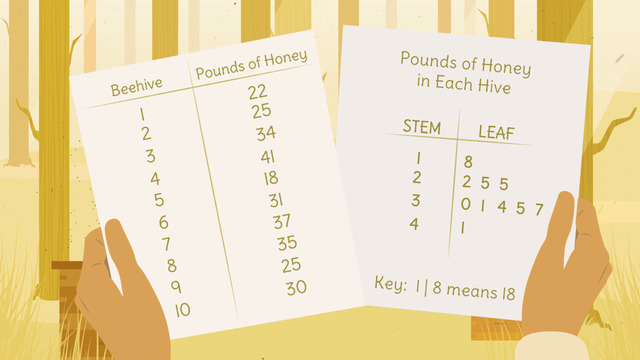
Ok, now that we've reviewed how to make a stem-and-leaf plot, take a look at the data from Buford’s entry from last year. Here's a table with last years' honey production. He identified the smallest and largest data points, 18 and 41. The stem is the leftmost column and lists the digits of each number, but excluding the rightmost digit. So in this case, we write the tens digit of each data point, with no repeating digits. Therefore, our stem is made up of 1, 2, 3 and 4.
The numbers listed in column two are the leaves and represent the digits in the ones’ place for each number in the data set. Buford's stem-and-leaf plot looks good. He titled his plot: Pounds of Honey in Each Hive. Notice the leaves are listed in ascending order, and the repeats are listed as needed. The key shown at the bottom helps you understand the chart.
The data is easy to interpret. It’s obvious the most common values range from 30 to 39 and, to figure out how many beehives produced at least 30 pounds of honey – you can just count the leaves: one, two, three, four, five and six.
Back to Buford and his bees. Last years, he walked away with the prize but what about this year? He weighs the annual amount of honey for each beehive. The honey drips and so does Buford. He's really nervous.
Uh oh! What the buzz?! The honey production is way down! Buford wonders why the production of honey produced by the bees has decreased by so much, and he's determined to find out why. Oh no! The bees have gone on strike. Can you believe it? They want to form a union!
Stem and Leaf Plots exercise
-
Explain how to create a stem and leaf plot.
HintsYou can check your stem and leaf plot by counting the leaves. This number must correspond to the number of data points.
This is a possible key: 21 | 3 stands for 21.3.
- 21 represents the stem.
- 3 is a leaf.
The advantage of a stem and leaf plot is that it's easy to create and to interpret.
SolutionHow do we create a stem and leaf plot?
First, we look for the smallest and largest numbers.
Next, we create the stem: a vertical column listing the digits of each number excluding the right most number. Repeating numbers are listed just once.
Last we add a leaf: list the last digit for every data point in descending order, noting that repeated data points are listed as often as they appear.
We can check that the number of leaves corresponds with the number of all data points.
For a better understanding, it's useful to write a key down.
-
Create a stem and leaf plot.
HintsThe digits of the numbers excluding the most right, are listed starting with the lowest in the stem column. Each number is listed only once.
The leaf column contains every right digit which appears for each steam value.
The right digits are listed as often as they appear.
SolutionThe solution can be seen here.
The lowest number of the data set is $21.3$ and the highest one is $24.5$.
So the numbers $21$ up to $24$ are listed in a stem column. Each number is listed only once, even if it appears more than one time.
Next, the last digits are listed in the leaf column. They are listed as often as they appear.
-
Find the right key.
HintsThe stem contains the digits of the numbers excluding the most right one.
The digits most right are listed as leaves, and are listed as often as they appear.
You can recognize the key by the original list of data.
SolutionTo the right you see the stem and leaf plot for the example given in the video. Let's check the plots beginning with the first one:
The data list is given by $\{$104, 111, 104, 121, 107, 112, 123, 123, 141, 148$\}$ with the key "10 | 4 means 104".
Next, the middle plot: the data list is given by $\{$104, 105, 112, 113, 113, 121, 137, 142, 145$\}$ with the key "11 | 3 means 113".
Last, we examine the lower plot: the data list is given by $\{$103, 103, 105, 111, 122, 124, 125, 133, 137, 144$\}$ with the key "12 | 2 means 122".
-
Combine the data sets with the right stem and leaf plots.
HintsFirst, you can count the number of leaves. This number must correspond to the number of elements in the data set.
Compare the data in the plot with the given key of the data set.
You can also rewrite all the information in the plot as a set of data.
SolutionHow can we determine which plot belongs to the given data?
There are different ways we can check which set of data belongs to which stem and leaf plot:
- We count the number of leaves which appear in the stem and leaf plot, which must correspond to the number of data points in the list.
- Looking at the key, we can recognize the kind of the data: whole numbers or decimal numbers.
- We can check the data itself using the given key.
-
Name the advantage of stem and leaf plots.
HintsTry to create this stem and leaf plot on your own.
You can check immediately, for example, that four elements belong to the first stem $21$.
SolutionWhy should we create a stem and leaf plot?
The advantages are the following:
- This kind of plot is quick to made.
- Whole numbers appear in this plot.
- They are easier to interpret.
-
Create a data set.
HintsPay attention to the key.
Remember that repeating leafs give repeating data points.
Let's have a look at the following example, with stem on the left and leaf on the right:
- $3~~|~~4$ stands for 34 with the key "1 | 2 means 12".
- $3~~|~~4$ stands for 3.4 with the key "1 | 2 means 1.2".
- $3~~|~~4$ stands for 0.34 with the key "1 | 2 means 0.12".
SolutionLet's start with the first plot,
$\begin{array}{c|l} \text{stem}&\text{leaf}\\ \hline 1&1~3~4~5\\ 2&1~1\\ 3&\\ 4&2~2\\ \end{array}$
with the key "1 | 4 means 1.4"
The corresponding data set is given by $\{$ 1.1, 1.3, 1.4, 1.5, 2.1, 2.1, 4.2, 4.2$\}$.
Next, we have
$\begin{array}{c|l} \text{stem}&\text{leaf}\\ \hline 1&4~4~5\\ 2&\\ 3&3~3~7\\ 4&1\\ \end{array}$
with the key: "3 | 3 means 33". This plot corresponds to the following data set: $\{$14, 14, 15, 33, 33, 37, 41$\}$.
Lastly, we have
$\begin{array}{c|l} \text{stem}&\text{leaf}\\ \hline 23&1~1~4\\ 24&\\ 25&2~8 \end{array}$
with the key: "23 | 1 means 2.31". This results in the data set $\{$2.31, 2.31, 2.34, 2.52. 2.58$\}$.