The Graph of a Linear Equation in Two Variables Is a Line

Basics on the topic The Graph of a Linear Equation in Two Variables Is a Line
One quick way of graphing a linear equation in two variables is by determining its x- and y-intercepts, plotting them in a coordinate plane, and then connecting them to make a line. The x-intercept is the value of x when y is zero while the y-intercept is the value of y when x is zero. Every graph of a linear equation in two variables has a steepness, or slope, that is captured by calculating the change in y over the change in x of two given points on the line. Learn how to graph a linear equation in two variables by helping Evelyn prepare for a death-defying jump in a motorcycle show. Common Core Reference: CCSS.MATH.CONTENT.8.FA.2
Transcript The Graph of a Linear Equation in Two Variables Is a Line
Meet Evelyn K. Neevil. For her famous grandfather's birthday, she's planning a death-defying jump. But, unlike her grandfather she prefers not to break any bones while doing her stunts. To avoid this fate, she and her team will investigate Graphing Linear Equations with Two Variables.
Evelyn knows the equations for the two ramps she plans to use for her jump. The equation of the first ramp in slope-intercept form is 'y' equals one-half 'x' plus 1 and the second equation, also in slope-intercept form, is 'y' equals negative one-fourth 'x' plus 5. But, what do these ramps look like? We know the formula for each ramp is a linear equation as all variables in both equations are raised to the first power we know that the graphs of such linear equations are lines.
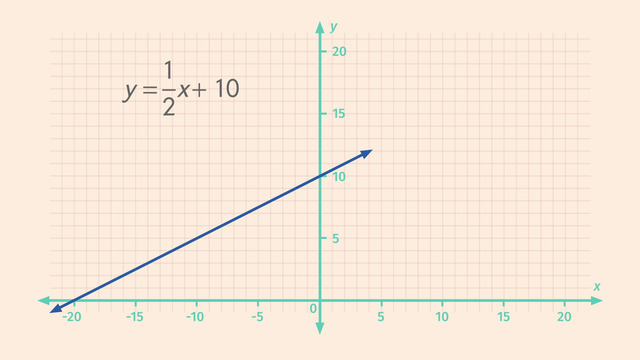
Let's help Evelyn figure out how steep each ramp is. To do this, we need to look at the slope of each line. Let's graph the two linear equations. From the graph, we'll be able to see how deadly Evelyn's jump will be. How do we graph a linear equation? An easy way is to calculate the 'x-' and y-intercepts. Let's first find the y-intercept. The y-intercept is the point where the graph of the line intersects the y-axis. The x-coordinate of the y-intercept is always zero. So, to find the y-coordinate of the y-intercept just set 'x' equal to zero. We can plug zero into the equation and then solve for 'y'. Since anything times zero is equal to zero, we’re left with 'y' equals 10. So, our first coordinate is the ordered pair, (0, 10). Remember, coordinates are ordered pairs that indicate specific positions on the coordinate plane. See how this coordinate sits on the y-axis? But how do we find the coordinate, or point, that intersects the x-axis? That’s right! We just have to set ‘y’ equal to zero and solve for ‘x’! We get zero equals one-half 'x' plus 10. Using opposite operations, we first move the 10 to the other side. And since ‘x’ is multiplied by 1/2 to isolate the variable we need to multiply both sides by the inverse of 1/2, which is 2 giving us -20 = ‘x’. Thus, the x-intercept is the ordered pair, (-20, 0).
Now that we know the two intercepts we can draw a line connecting them. Now we can see how steep the first ramp is! With a slope of 1 over 2. Looks pretty steep, right?! Now, let’s find the 'x-' and y-intercepts for the second linear equation. If we recognize that the equation is in slope-intercept form we know the y-int will simply be 5. So, since our 'x' coordinate is zero, our 'y' intercept is (0, 5). Just like before. To find the x-intercept we set ‘y’ equal to zero and solve for ‘x’. We get zero equals negative one-fourth 'x' plus 5. Using opposite operations, we first move the 5 to the other side by subtracting and since we multiplied ‘x’ by -1/4, we need to multiply both sides by -4 to isolate the 'x' giving us ‘x’ = 20. So, the line 'y' equals negative one-fourth 'x' plus 5 intersects the x-axis at (20, 0) and intersects the y-axis at (0, 5). Connecting the dots, we can easily see how steep the second ramp is with a slope of negative one over four.
Looks like all the preparations are ready, and Evelyn K. Neevil is ready for her jump. There she goes!!! Will...she...make iiiiit!?!?
The Graph of a Linear Equation in Two Variables Is a Line exercise
-
Describe how to graph the line corresponding to the equation $y=\frac13x +12$.
HintsA general linear equation has the form, $y=x+b$, where $m$ is the slope and $b$ the $y$-intercept.
The $y$-intercept lies on the $y$-axis, while the $x$-intercept lies on the $x$-axis.
Here we see the solution of an equation similar to the equation in this problem.
SolutionThere is an easy way to graph the line corresponding to this equation: determine the intercepts of both coordinate axes and draw the line which goes through both points.
Keep in mind that you only need two points to draw a line uniquely.
The $y$-intercept has the $x$-coordinate $x=0$.
We plug this into the equation, $y=\frac13x +12$, to get:
$y=\frac13(0)+12=0+12=12$.
So the point where the line crosses the $y$-axis is $(0,12)$.
Generally, the $y$-intercept is the term without $x$ in the linear equation: $y=mx+b$, namely $b$.
The x-intercept has the $y$-coordinate $y=0$.
We plug this into $y=\frac13x +12$ to get $0=\frac13x+12$.
We solve this equation using opposite operations:
$\begin{array}{rcl} 0 & = & ~\frac13x+12\\ \color{#669900}{-12} & &\color{#669900}{-12}\\ -12 & = & ~\frac13x\\ \color{#669900}{\times 3} & & \color{#669900}{\times 3}\\ -36 & = & ~x \end{array}$
So the point where the line crosses the $x$-axis is $(-36,0)$.
-
Decide which statements about linear equations are true.
HintsThe $y$-intercept is the $y$-coordinate of the point where the line crosses the $y$-axis.
Just look at the $y$-axis and the numbers on the $x$-axis:
- On the left of the $y$-axis we have $x=-1$.
- On the right of the $y$-axis we have $x=1$.
Here you see an example of a linear equation. Plugging $x=0$ into the equation leads to $y=4(0)+3=0+3=3$.
This is a quadratic equation.
SolutionHere you see a linear equation in a generalized form:
- $m$ is the slope.
- $b$ is the $y$-intercept.
So, let's have a look at the coordinate-intercepts:
To get the $y$-intercept, just plug $x=0$ into the equation to get:
$y=m(0)+b=0+b=b$.
To get the $x$-intercept, you have to solve the equation $0=mx+b$.
Subtract $b$ to get $-b=mx$, then divide both sides by $m$ to get the $x$-intercept $x=-\frac bm$.
-
Identify the $x$- and $y$-intercepts for each line.
HintsThe $x$-coordinate of the $y$-intercept is $x=0$.
The $x$-intercept has the $y$-coordinate, $y=0$.
SolutionThe $y$-intercept of a line is where it intersects the $y$-axis, and the $x$-intercept of a line is where it intersects the $x$-axis. With this, we can read off the $x$- and $y$-intercepts of each line:
$~$
The first line
- $y$-intercept: $(0,4)$
- $x$-intercept: $(-4,0)$
The second line
- $y$-intercept: $(0,2)$
- $x$-intercept: $(5,0)$
The third line
- $y$-intercept: $(0,6)$
- $x$-intercept: $(-2,0)$
The fourth line
- $y$-intercept: $(0,4)$
- $x$-intercept: $(2,0)$
-
Find the $x$- and $y$-intercepts for the given equations.
HintsThe $y$-intercept of $y=mx+b$ is $(0,b)$.
To solve this equation:
- Subtract $b$ on both sides to get $-b=mx$.
- Divide both sides by $m$ to get $x=-\frac bm$.
SolutionIn general, this equation has the $y$-intercept $(0,b)$, and the $x$-intercept $\left(-\frac bm,0\right)$.
So for the given equations we have the following $x$- and $y$-intercepts:
$\mathbf{y=\frac12x-4}$
- For $x=0$, we get $y=-4$ and so $(0,-4)$ is the $y$-intercept.
- $x=-\frac{-4}{0.5}=8$, which gives us $(8,0)$ as the $x$-intercept.
- $(0,4)$ is the $y$-intercept.
- $x=-\frac42=-2$ leads to $(-2,0)$ as the $x$-intercept.
- $(0,-12)$ is the $y$-intercept.
- $x=-\frac{-12}{-3}=-4$ gives us the $x$-intercept $(-4,0)$.
- $(0,-2)$ is the $y$-intercept.
- $x=-\frac{-2}{-0.5}=-4$ gives us the $x$-intercept $(-4,0)$.
-
Plot the ordered pairs on a coordinate plane.
HintsKeep in mind that the first coordinate of an ordered pair is the $x$-coordinate, and the second one is the $y$-coordinate.
To draw a point proceed as follows:
- Draw a line parallel to the $y$-axis, which intersects the given $x$-coordinate.
- Draw a line parallel to the $x$-axis, which intersects the given $y$-coordinate.
- The intersection of these two lines is the desired point.
SolutionHere you see the correct ordered pairs. To plot them on the coordinate plane, first remember:
- The left-most coordinate is the $x$-coordinate.
- The right-most coordinate is the $y$-coordinate.
- Draw a line parallel to the $y$-axis, which intersects the given $x$-coordinate.
- Draw a line parallel to the $x$-axis, which intersects the given $y$-coordinate.
- The intersection of these two lines is the desired point.
- $(0,6)$ the green one on the $y$-axis
- $(3,4)$ the blue one
- $(6,2)$ the violet one
- $(9,0)$ the yellow one on the $x$-axis
-
Graph the line for the equation $f(x)=\frac{20}{3}x+20$.
HintsFirst check the $y$-intercept. This is the constant term of the equation.
You have to solve the equation, $0=mx+b$, to get the $x$-intercept. This leads to $x=-\frac bm$.
SolutionThe linear equation is given by $y=\frac{20}3x+20$.
We can see the $y$-intercept from the equation: $b=20$. This is the point $(0,20)$.
To get the $x$-intercept, we have to solve the following equation:
$\begin{array}{rcl} 0 & = & ~\frac{20}3x+20\\ \color{#669900}{-20} & &\color{#669900}{-20}\\ -20 & = & ~\frac{20}3x\\ \color{#669900}{\times \frac3{20}} & & \color{#669900}{\times \frac3{20}}\\ -3 & = & ~x \end{array}$
So the $x$-intercept is the point $(-3,0)$.
Drawing the line which goes through these two points gives us the line corresponding to the equation, $y=\frac{20}3x+20$.


