Interpreting Graphs of Proportional Relationships


Basics on the topic Interpreting Graphs of Proportional Relationships
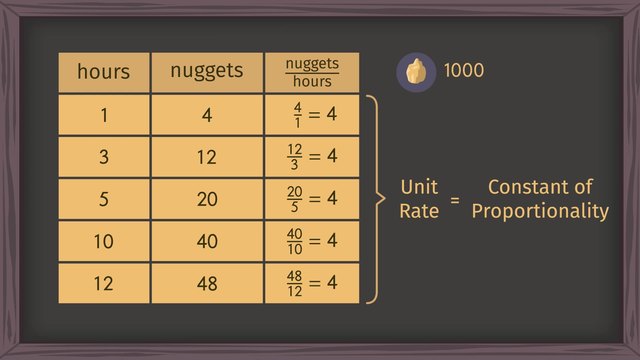
After this lesson, you will be able to identify graphs that represent proportional relationships, find unit rates, and write equations.
The lesson begins by teaching the characteristics of graphs that represent proportional relationships. It leads to finding the slope, k, or constant of proportionality. It concludes with writing equations of proportional relationships.
Learn about the graphs of proportional relationships by helping Detective Egon Spongler uncover the secrets of paranormal activity.
This video includes key concepts, notation, and vocabulary such as the graph of a proportional relationship (a straight line through the origin) and equations representing proportional relationships (y=kx where k is the slope).
Before watching this video, you should already be familiar with the definition of a rate, unit rate, and proportional relationship, as well as identifying these terms from a table that represents relations.
After watching this video, you will be prepared to learn how to plot and interpret points in a coordinate plane, make the connection between a point and the equation of a line containing the point, and identify the equation of a different type of line.
Common Core Standard(s) in focus: 7.RP.A.2 A video intended for math students in the 7th grade Recommended for students who are 12 - 13 years old
Transcript Interpreting Graphs of Proportional Relationships
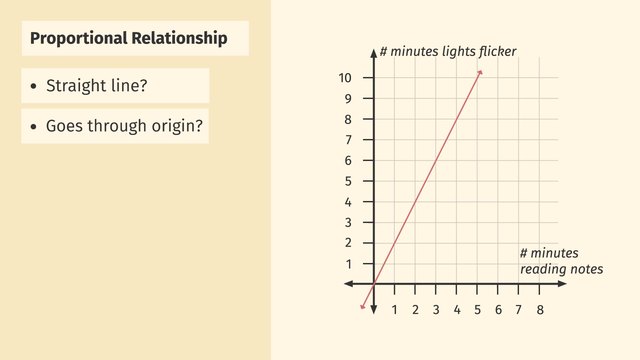
Detective Egon Spongler specializes in uncovering the secrets of the paranormal. He is on his way to see Old Lady Foster, who is convinced her house is haunted. A cold wind chills him to his bones as he knocks on the creaking door. Old Lady Foster greets Egon with some cookies. Egon eats a cookie and objects begin to float behind Lady Foster! They eventually fall back to the ground. It seems to be that the more cookies he eats, the longer the objects float. Egon will have to interpret graphs of proportional relationships in order to make sense of this paranormal activity. Lady Foster hands Egon a graph showing the relationship between the number of cookies eaten and the number of minutes objects are floating. If this graph represents a proportional relationship, then detective Spongler can predict the ghosts behavior using the equation for the proportion from the graph. But how can we tell if this graph represents a proportional relationship? A graph represents a proportional relationship if it is a line which goes through the origin. We can see that this graph is a line, but it does not pass through the origin! At 'x' equals zero, we can see that 'y' equals 3. A straight line that DOESN’T go through the origin, DOESN’T represent a proportional relationship. Egon is skeptical. Ghosts normally engage in PROPORTIONAL paranormal behavior. He decides to go through his notes on poltergeists. When Egon reads his notes for one minute, the lights flicker for two minutes! He goes back to reading his notes for two minutes, and the lights flicker for four minutes! He reads for three minutes, and there is six minutes of flickering! Woah, is this a paranormal proportion? Egon graphs the relationship between 'minutes of notes read' and 'minutes the lights flicker'. The graph is a line; the amount of time the lights flicker increases at a constant rate as the notes are being read. We can also see that the graph goes through the origin, that is, zero, zero. When zero notes are read, there are zero light flickers. So this graph does represent a proportional relationship! We can now get an equation for the proportion from this graph which Egon can use to predict this paranormal behavior. The slope of such a line is the constant of proportionality 'k'. Any point (x,y) on the line can be interpreted as the ratio of 'y' to 'x'. Rewriting this ratio as the fraction 'y' over 'x' gives us the slope! For instance, we can rewrite the point (3,6) as 6 over 3, which simplifies to the constant of proportionality 2. In general, we can rewrite the point at 'x' equals 1 as the ratio 'y' over 1, which equals 'y'. This tells us that the 'y'-coordinate at 'x' equals 1 is our constant of proportionality 'k'. In this case, the point at 'x' equals 1 is (1,2)...giving us the constant of proportionality, 2 over 1, which is 2. Going back and rewriting our equality, we see that we get the equation for our proportional relationship, y=kx. Plugging in our constant of proportionality into this equation, we have that the proportional relationship between minutes of notes read and minutes the lights flicker is 'y=2x.' So if Egon reads his notes for 10 minutes, the lights will flicker for 20 minutes! Old Lady Foster takes detective Spongler to the library to share some of her notes with him. The library is quite dusty. Foster dusts her notes off for just a second, and books fall from the shelf! Spongler quickly brings out his stopwatch. When Foster dusts her notes for one second, books fall from the shelf for one-third of a second. When she dusts her notes for 2 seconds, books zoom off the shelf for two-thirds of a second. When she dusts for 6 seconds, books fall for 2 seconds--what a mess! Egon scrambles to graph the data of time dusting vs. falling books Does this graph represent a proportional relationship? It is a line that goes through the origin. So this graph DOES represent a proportional relationship. To get the equation for the proportion from the graph, we first find the constant of proportionality 'k' by locating the point at 'x' equals 1. In this case, it is the point (1, one-third). We then know that the constant of proportionality 'k' is one-third. With this, the equation from this graph is 'y' equals one-third 'x'. Using this equation, Egon can predict that if Lady Foster dusts her notes off for 15 seconds, then books will fall from the shelf for--AHHHH!--5 seconds. Spongler is still skeptical. But if not ghosts, then what is causing all this chaos in Lady Foster's house!? Let’s review. A graph represents a proportional relationship if it is a line which goes through the origin. The 'y'-coordinate when 'x' equals 1 is the constant of proportionality 'k,' and the equation from the graph is given by y=kx. Egon goes to inspect the bookshelf, and spots one of his favorite books! ...what's this!? Old Lady Foster’s trickster twin sister, manipulating levers and pulleys to control objects in the house! What an elaborate prank. But wait, there aren’t any LIGHT switches on the control panel. Who WAS causing all the light flickering?