Identifying Positive Proportional Relationships in Graphs


Basics on the topic Identifying Positive Proportional Relationships in Graphs
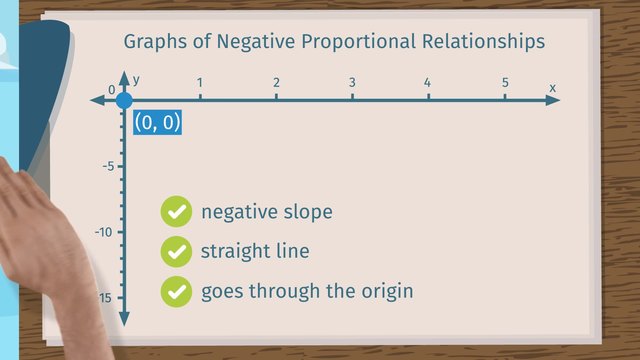
After this lesson, you will be able to identify the graph of a positive proportional relationship as a line with a positive slope, passing through the origin.
The video begins with a review of linear relationships and proportionality. It leads to identifying three characteristics of the graphs of positive proportional relationships, and applies them to three examples.
Learn about the graphs of positive proportional relationships by helping Balbus build a royal set of stairs for the Caesar!
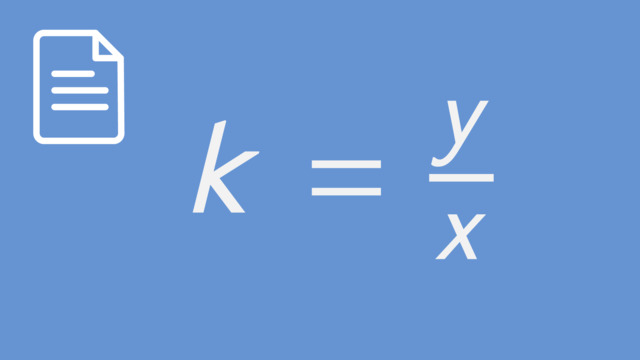
This video includes key concepts, notation, and vocabulary such as: the characteristics of a positive proportional relationship (a straight line, going through the origin, with a positive slope); linear relationship (represented by a line on the coordinate plane, where the slope or rate of change always stays the same); positive slope (when x increases and goes the right, y increases and goes up); the constant of proportionality (in a proportional relationship, the constant which is equal to the slope of the line); and origin (the point (0,0) on the coordinate plane).
Before watching this video, you should already be familiar with proportional relationships and their characteristics.
After watching this video, you will be prepared to learn more about the constant of proportionality and how it relates to a unit rate.
Common Core Standard(s) in focus: 7.RP.2a A video intended for math students in the 7th grade Recommended for students who are 12-13 years old
Transcript Identifying Positive Proportional Relationships in Graphs
Having just been appointed to a seat on the ancient Roman Senate Blandus Balbus receives his first official order directly from the Caesar. And it is the Caesar wants a bath. A hot spring bath, to be specific on an idyllic woodland hillside just outside of the city. But how is a dignified Caesar supposed get all the way up there? Walk on the dirt like an animal? Balbus visits a local architect to solve this problem. The architect claims his cutting-edge positive proportional relationship technology will ensure a majestic walk from the city center to the bath with a gentle slope dignified enough for the royal Caesar. It seems like this architect can handle the job that is, if we can help Senator Balbus identify positive proportional relationships in graphs. Before we look at the architect's plans, let's review what we know about the graphs of positive proportional relationships. First of all, positive proportional relationships are linear. Linear means that the slope, or rate of change, always stays the same. That's why their graphs are straight lines. Next, the slope of a positive proportional relationship is, of course, positive. That means as 'x' increases and goes to the right 'y' increases and goes up. Finally, in a positive proportional relationship, all points on the graph represent equivalent ratios. These ratios can be written by taking any y-coordinate and dividing it by its corresponding x-coordinate. This ratio is equal to the slope of the line, or constant or proportionality, 'k'. That means in order to find any y-value on the graph you can take your slope, which is the constant of proportionality, 'k' and multiply it by the corresponding 'x'-value. So, when 'x' equals zero 'y' must also equal zero. Because zero times any value is zero. This is why a positive proportional relationship must pass through the origin, or the point (0, 0). Ok, now that we know what we're looking for, let's take a look at our first set of plans. The architect presents Balbus with a proposal for an imperial set of stairs. He claims these plans are modeled after the graph of a positive proportional relationship. Let's quickly plot the points and check. What do you think? Does it match the criteria? Well it looks like the graph does go through the origin, so we know it meets that requirement. And as the graph starts out, the y-values appear to increase as 'x' increases but what happens at point (1,3)? Then what happens at point (3,5)? The rate of change does not stay the same. This graph is all over the place! It is not a straight line and does not meet the requirements of a positive proportional relationship. Balbus storms back to the architect who presents him with a new and improved plan. This time, he swears the stairs will be perfectly straight! Balbus looks over the revised plans. What do you think? Does this plan pass the positive proportional relationship test? The points do seem to fall in a straight line, so it passes that test. And the line connecting these points does have a positive slope. It looks like Balbus is going to give the stairs a test run but the first step is three meters in the air! That's because this graph doesn't go through the origin! It's a straight line with a positive slope, but it's not a proportional relationship. Meanwhile, the Caesar is losing his patience. It's time for Balbus to take matters into his own hands! Using what he knows about proportional relationships, Balbus designs his own set of stairs for the Caesar. Let's check and see if they pass the test. It looks like the 'x' and 'y' values have a constant rate of change because the points all appear in a straight line. As the 'x' values increase and go to the right, the 'y' values are also increasing and going up. So this graph has a positive slope. Finally, the stairs also pass through the origin, (0, 0). A straight line with a positive slope that passes through the origin? It's a positive proportional relationship! Let's review what we've learned about the graphs of positive proportional relationships. Positive proportional relationships are special types of linear relationships. Because these relationships are linear, their graphs are straight lines. And because their slopes are positive, the x-value increases and goes to the right as the y-value increases and goes up. Finally, because these are graphs of proportions, they must pass through the origin. It looks like Balbus has proven he's got what it takes to be a Roman sentator. Caesar's next request? Can we get a lock on that door?


nice