Comparing Constant Rates


Basics on the topic Comparing Constant Rates
After this lesson, you will be able to compare constant rates in different forms.
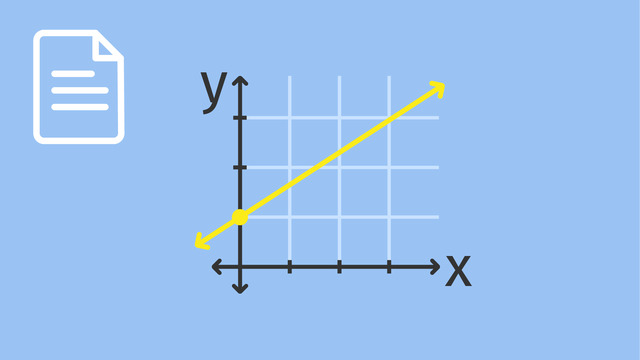
The lesson begins by teaching you that a constant rate like speed can be shown as a table, equation, or graph. It leads you to learn how to compare speeds by graphing or using an equation. It concludes with the understanding that the constant rate is the slope which determines the steepness of the line.
Learn about comparing constant rates by helping Tim and Nora investigate on zombies’ speed in three films!
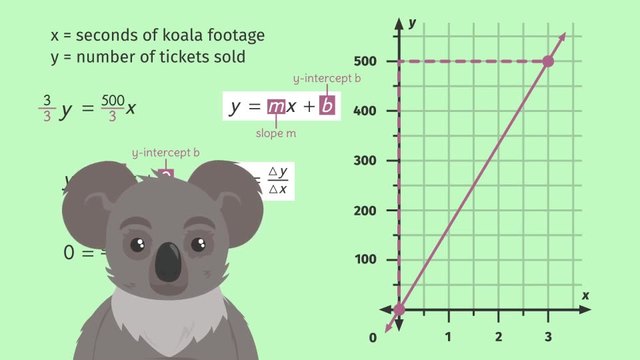
This video includes key concepts, notation, and vocabulary such as rate of change (the rate at which a quantity changes in relation to another); constant rate (fixed or unchanging rate of change); slope (the ratio of the vertical change to the horizontal change between two unique points in a line on a Coordinate Plane); and proportional relationships (two quantities related by equivalent ratios when presented in a table or graphically seen as a line which passes through the origin).
Before watching this video, you should already be familiar with the origin, y-intercept, and the slope-intercept form of a linear equation (y=mx+b).
After watching this video, you will be prepared to learn about systems of linear equations.
Common Core Standard(s) in focus: 8.EE.B.5 and 8.EE.B.6 A video intended for math students in the 8th grade Recommended for students who are 13-14 years old
Transcript Comparing Constant Rates
It’s Friday the 13th in the sleepy suburb of Shadow Hills.
Tim has invited his friend, Nora, for a zombie film marathon at his place.
While watching the movies, Tim and Nora realize that the zombies' speed always changes depending upon the movie.
In some movies, the zombies are fast and in others, they’re really slow.
This truly annoys Tim and Nora. So they want to take a closer look.
To investigate the various zombie speeds, the two friends should compare constant rates.
They’ve gathered information on zombies' constant rates of speed from three of their favorite films.
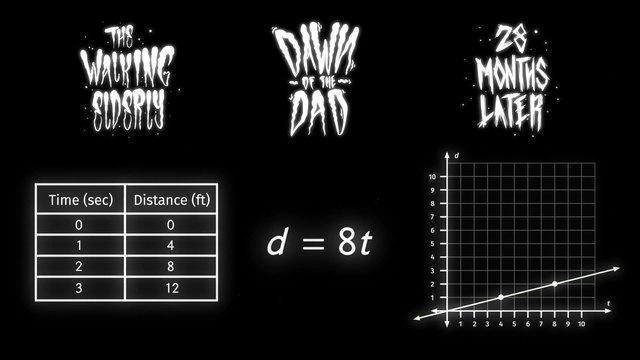
From The Walking Elderly, we have a table from Dawn of the Dad, an equation and from 28 Months Later, a graph.
Each representation includes the zombies' speeds in feet per second.
Can we compare tables, to equations, to graphs?
We can, if we convert the different representations into the same format.
Looking at the table from Walking Elderly, we can see a constant change in distance covered by the zombies for every one second they're walking.
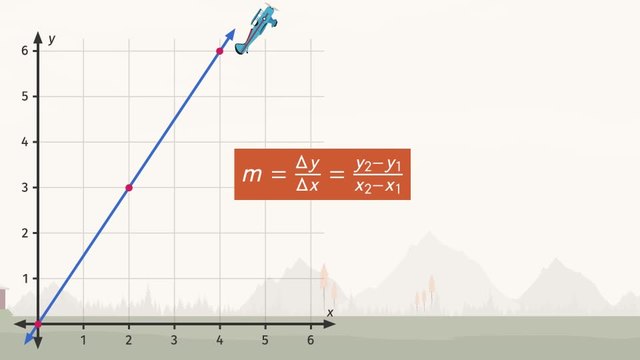
Because the zombies have a constant rate of speed at 4 feet per 1 second we can use that rate as the slope of the graph.
Therefore, using 'd' for distance and 't' for time we can express the table as the equation 'd' equals '4t'.
On the graph the horizontal axis is 't', and the vertical axis is 'd'.
Since we want to graph this equation, we should start at the origin and, using the slope, put a point on the graph each time we move right 1 and up 4.
This represents the point (1, 4) and using the same steps of the slope, this represents the point (2, 8).
We can check to see if these points are correct by matching them to our table.
Because our points are correct we can now draw the line.
Let's look at the next bit of information from Dawn of the Dad.
We already have the equation for the zombies here: 'd' equals '8t'.
We can graph it using the same steps from before.
Notice that the y-intercept is zero so we can start plotting the graph at the origin.
What is the constant rate of speed for the zombies in this movie?
If you said 8 feet per second, you're exactly right!
We can use 8 over one as the slope.
Graphically this means to go right 1 and up 8.
Since we're working with a linear equation, graphing leaves us with a line.
Two movies down, one movie to go.
For 28 months later we already have a graph...but what's the equation?
If we reverse our process from before, we can figure it out.
Can you find the slope of the line?
Let's examine these exact points.
We can see to get these points we go to the right 4 and up one, at a constant rate.
Remember the slope is the change in the vertical values over the change in the horizontal values.
Which is one fourth here.
But what about the y-intercept?
It passes through the origin - and any line that passes through the origin has a y-intercept of zero.
Therefore, our equation for the last movie is 'd' equals one-fourth 't' plus zero.
But mathematicians always simplify so we can write it as 'd' equals one fourth 't'.
Now that we have converted the tables, graphs, and equations to the same representations for all three movies we can compare them graphically and algebraically.
First, notice that all three equations lack a y-intercept term, so they all start at the origin.
Therefore, the only difference in the graphs should be their steepness represented by their slopes.
When is the graph of an equation the steepest?
It’s steepest when it has the highest coefficient, or, the number that represents the slope.
Here, the steepest graph is represented by 'd' equals '8t'.
Remember, the slopes here represents the zombies' speeds so the zombies from Dawn of the Dad are the fastest and the zombies in 28 Months Later have the slowest speed at one fourth of a foot per second.
To summarize, the constant rate is the slope, which can be seen in the equation as the coefficient of your independent variable and in the graph as the steepness of the line.
Tim and Nora's movie marathon is just about over. What's that? A zombie?!?
That zombie is fast. Must be from Dawn of the Dad.
Oh whew!
It’s just Tim’s grandma...and she has pie.
Comparing Constant Rates exercise
-
Convert between different representations of constant rates.
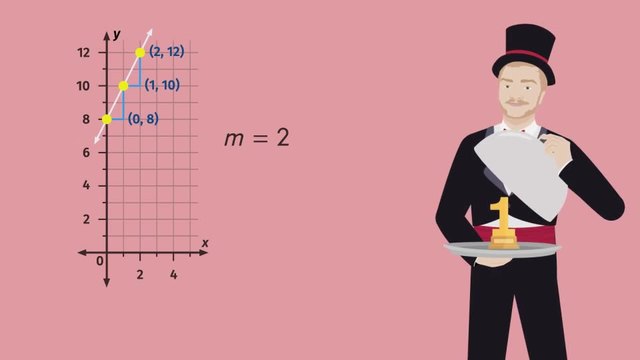
HintsThe slope of this line is $\frac{5}{1}$, or $5$. The equation is $y=5x$.
This line has a slope of $\frac13$. The equation is $y=\frac13x$.
In the table, as time $t$ increases by $1$, distance $d$ increases by $6$. That means the slope is $\frac61$ or $6$. The equation is $d=6t$. The points in the table are on the graph of the line.
In the table, as time increases by $7$, distance increases by $1$. That means the slope is $\frac17$ and the equation is $d=\frac17t$. The points in the table are on the graph of the line.
The slope of this line is $\frac19$. To get a point on the graph of this line, we can plug in $9$ for $x$ and get $1$ for $y$. That gives us the point $(9,1)$. We can also plug in $18$ for $x$ and get $2$ for $y$. That gives us the point $(18,2)$.
SolutionThe points $(0,0)$ and $(2,1)$ are on one graph. There is a table which contains the same values.
The points $(0,0)$ and $(1,4)$ are on one graph. There is a table which contains the same values.
The points $(0,0)$ and $(1,8)$ are on one graph. The slope of this line is $\frac81$. The equation $d=8t$ has the same slope of $8$.
The points $(0,0)$ and $(4,1)$ are on one graph. The slope of this line is $\frac14$. The equation $d=\frac14 t$ has the same slope of $\frac14$.
The points $(0,0)$ and $(1,1)$ are on one graph. The slope is $1$. The equation $d=t$, that is, $d=1t$, has the same slope of $1$.
-
Compare and contrast the following linear equations.
HintsFor the equation $y=3x$, the slope is 3. For the equation $y=\frac13x$, the slope is $\frac13$.
If the slope of a linear equation is positive, it slopes upwards as we look at the graph from left to right.
The larger the slope, the steeper the graph.
All linear equations of the form $y=mx$ have a y-intercept of $0$. That means all such lines go through the point $(0,0)$, the origin.
All linear equations of the form $y=mx$ are straight lines.
Solution\begin{array}{c|c|c} \text{equation} & \text{slope} & \text{y-intercept}\\ \hline d=8t & 8 & 0\\ d=4t & 4 & 0\\ d=\frac14 t & \frac14 & 0\\ \end{array}
Here we can see the graphs of these three equations, along with a table organizing some information about them.
Slope and steepness
- The slope is the number multiplied by the variable $t$. The larger the slope, the steeper the graph.
- If the slope is positive, the graph slopes up from left to right.
- A slope of $\frac41$ is different from a slope of $\frac14$.
- Each graph goes through the origin $(0,0)$, so they all have the same y-intercept of $0$.
\begin{array}{l|l|l|c} \text{equation} & \text{if}& \text{then} &\text{point on graph}\\ \hline d=4t & t=3 &d=4(3)=12 & (3,12) \\ d=\frac14 t & t=12 & d=\frac14(12)=3 & (12,3) \end{array}
-
Graph the constant rate equation, $y=2x$.
HintsGiven the line $y=5x$, we can find points on the line by substituting values for $x$.
For example, if $x=3$, then:
$y=3(5)=15$
Here is a table showing several points on the line $y=5x$:
\begin{array}{c|c} x & y\\ \hline 0 & 0\\ 1 & 5\\ 2 & 10\\ 3& 15\\ 10 & 50\\ \end{array}
The graph of every constant rate equation goes through the origin, that is, the point (0,0).
Given the line $y=3x$, the slope is $3$, or $\frac31$. That means that from the origin $(0,0)$, we go $1$ unit right and $3$ units up, to arrive at the point $(1,3)$.
SolutionThis is the graph of $y=2x$.
If $x=3$, then:
$y=2(3)=6$
Here is a table showing several points on the line $y=2x$:
\begin{array}{c|c} x & y\\ \hline 0 & 0\\ 1 & 2\\ 2 & 4\\ 3& 6\\ 10 & 20\\ \end{array}
-
Determine the constant rate equation for each graph.
HintsThis is the graph of the line $y=(1/3)x$.
We can identify two points on the graph as shown, and draw a slope triangle. The slope triangle shows us that for each increase of $3$ in the $x$ direction, there is a corresponding increase of $1$ in the $y$ direction. This means the slope is $\frac13$.
We type the equation in as $y=(1/3)x$.
SolutionHow to use a slope triangle to write a constant rate equation:
- Connect two points that are on the line and on the grid.
- Draw a right triangle as shown to connect the two points.
- Count the horizontal and vertical change.
- Find the slope by dividing the vertical change by the horizontal change.
- Use the slope, $k$, to write the equation in the form $y=kx$.
- We choose the points $(0,0)$ and $(1,7)$.
- We draw a slope triangle.
- The horizontal change is $7$. The vertical change is $1$.
- The slope is $\frac17$.
- The equation is $y=\frac17 x$. We type that in as $y=(1/7)x$.
$ \begin{array}{c|l} \text{slope} & \text{line} \\ \hline 3 & y=3x\\ \frac16 & y=(1/6)x\\ 1 & y=x\\ \end{array} $
-
Order the equations from the steepest graph to the least steep graph.
HintsThe steepness of the graph is determined by the slope. A bigger slope means a steeper graph.
Given an equation in the form $y=mx$, the slope is $m$.
The slope of the line $y=10x$ is $10$. The slope of the line $y=\frac19x$ is $\frac19$. The graph of $y=10x$ is steeper than the graph of $y=\frac19$.
Solution- The steepest line is $y=12x$. This is because it has the largest slope, $12$.
- The least steep line is $y=\frac15 x$. It has the smallest slope, $\frac15$.
- Remember, the line $y=x$ can be written as $y=1x$. It has a slope of 1.
-
Compare the constant rates represented by graphs, tables, and equations.
HintsGiven a table like the one shown, we can find the slope by noticing that as $x$ increases by $1$, $y$ increases by $20$. This means the slope is $\frac{20}{1}$, or $20$. The equation is $y=20x$.
Given a graph as shown, we can connect any two points on the line (and on the grid) in order to show a slope triangle. The slope triangle shows us that for every increase of $1$ in the $x$ direction, there is a corresponding increase of $5$ in the $y$ direction. That means the slope is $\frac51$, or $5$. Therefore, the equation is $y=5x$.
Given two equations, we can compare their slopes to determine which is steeper. For example, let's compare $y=\frac13 x$ and $y=\frac14 x$. $\frac1/3$ is greater than $\frac14$, so the line $y=\frac13 x$ is steeper.
SolutionFirst, we have the graph of $y=\frac18 x$. The graph goes through the point $(8,1)$. The slope of this line is $\frac18$. This represents a rate of $1$ car every $8$ minutes.
Second, we have a table. When $x$ increases by $1$, $y$ increases by $11$. The slope of this line is $11$. Cars are passing at a rate of $11$ cars per minute. This line is the steepest of the three, because its slope is the largest. We can represent this constant rate with the equation $y=11x$.
Third, we have the equation $y=\frac19x$ which has a slope of $\frac19$. This is the smallest slope of the three. In this case, cars are passing at a rate of $1$ car every $9$ minutes.