Special Functions


Basics on the topic Special Functions
Not all functions are linear. The graphs of nonlinear functions are not lines, and so are sometimes a bit trickier to see. We will take a look at some special nonlinear functions to help us get a better intuition for how nonlinear functions can behave.
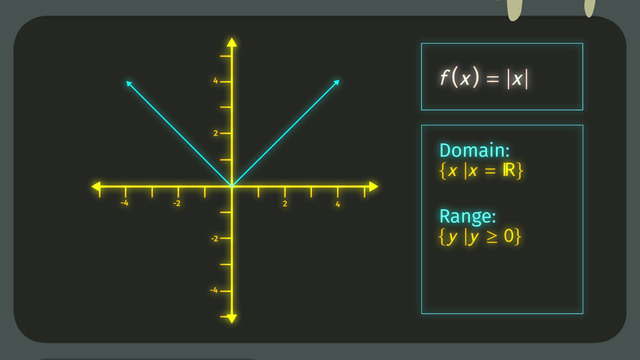
The first of such special function we will look at is f(x) = |x| (absolute value of x). Its domain consists of all real numbers and its range is all positive real numbers. The graph has two opposite diagonal lines above the x-axis.
Next we have f(x) = ⅟x (one over x). Its domain is all real numbers except zero and its range is also all real numbers except zero. Its graph is two outward curves that approach but never touch the x-axis and the y-axis.
The third special function is f(x) = √x (square root of x). The domain and range of this function both include all positive real numbers, including zero. Its graph is a curve that goes outward to the right (in the first quadrant of the coordinate system)..
We will also look at f(x) = sin x and f(x) = cos x (sine of x and cosine of x) Both of these functions’ domains include all real numbers, while both of their ranges will have real numbers between, and including, negative one and positive one. Both graphs look like waves that are found between the lines y=1 and y=-1.
Finally we have: f(x) = tan x (tangent of x). The domain is all real numbers, except values of π n+ π⁄2, where n is any integer, and the range is all real numbers. Its graph is multiple curves that approach but never touch all values of x of the form π n+ π⁄2.
Graphing nonlinear functions can be complicated! But it’s definitely a bit easier to draw a function’s graph when you know more about its domain and range; watching this video on graphing special functions will surely convince you.
Use functions to model relationships between quantities.
CCSS.MATH.CONTENT.8.F.B.5
Transcript Special Functions
We’re here in the Dr. Frank N. Stein Laboratory in Europe where Dr. Stein’s understudy, Dr. Em Kay, is taking her final exam in reanimation. Dr. Em Kay has to understand the graphs of special functions in order to make her specimen, Scarion, perform a few unassisted actions in order to pass her class.
Graphs of Special Functions
To do this, she can use the graphs of special functions! Dr. Kay has to input the equation of a function into the EKG and then shock Scarion with her new defibrillator, the Tesla DeFib 18. Dr. Em Kay knows that all of the equations she should use have to be functions, which means that they all have to pass the vertical line test. The good doctor has just finished her first trial. For this, she input the special function f(x) = |x|. She knows that the domain is all real numbers and the range is all numbers greater than or equal to 0. Okay, this move seems to work. Scarion's arms are in a 'v' shape, just like an absolute value graph. Dr. Em Kay hits the abort button so she can test another function.
Dr. Kay tries again. This time, she chooses f(x) = 1/x as her function. The domain for this function is all real numbers, except x = 0 and the range is all real numbers, except y = 0. Graphs that have variables in the denominator usually have asymptotes in their graphs. An asymptote is an invisible line such that another line or curve may get closer and closer to, but will never reach. This function has a vertical asymptote at x = 0 and a horizontal asymptote at y = 0. This looks like a fun dance move! Dr. Em Kay is ecstatic!
After resetting Scarion one more time, Dr. Kay moves on to the next formula. The next function Dr. Kay tries is sqrt(x). The domain for this function is x ≥ 0 and the range is y ≥ 0. Using this graph, Dr. Kay can turn Scarion into a smooth operator! Dr. Kay will soon be certified to perform reanimations!
For the next move, Dr. Kay wants Scarion to be able to do an arm wave. Dr. Kay tries the sine function, f(x) = sin x for Scarion's right arm and g(x) = cos x for Scarion's left arm. The domain and range for the sine and cosine functions are the same: the domain for both functions is all the real numbers and the range is -1 ≤ f(x) ≤ 1. Arm wave complete! There's just one last move Scarion needs to learn.
The last function Dr. Kay enters into her machine is f(x) = tan x. The domain and range for tangent: the domain for tangent is all the real numbers that are not divisible by π/2 + π(n) and the range is all the real numbers. Look at all the asymptotes on the tangent graph! Whoa! Look at that! Dance, Scarion, dance!!!
Summary
Let's do a quick review of the functions we covered in this video. The functions Dr. Kay used are: the absolute value of 'x', one over 'x', the square root of 'x' and the basic trig functions: sine, cosine and tangent. The domain of the absolute value of 'x' as well as all the trig functions is all real numbers. Tangent, however, has one exception, shown here, where 'n' is any integer value. The function one over 'x' has an exception at x = 0 since dividing by 0 is undefined. Otherwise, the domain of the function one over 'x' is all real numbers. Our final domain, for the square root of 'x', is all numbers greater than or equal to 0.
For our ranges, we have two functions that will produce values greater than or equal to 0 - the absolute value function and the square root function. The function one over 'x' has a range of all real numbers except f(x) = 0. For the trig functions, both sine and cosine produce numbers between -1 and 1, inclusive. And finally, the tangent function has a range of all the real numbers. Let's check in on the good doctor, mmmkay?
Look at Scarion move!! wait...some of those dance moves weren't programmed by Dr. Kay! Scarion...she's ALIVE!!!
Special Functions exercise
-
Decide which graph belongs to which function.
HintsYou can recognize the absolute value function by the v-shape.
With the function $f(x)=\frac 1x$, for increasing values of $x$, you get decreasing values of $y$. Thus we have the $x$-axis as an asymptote.
SolutionYou can recognize the absolute value function $f(x)=|x|$ by the v-shape. So that's the graph on the left above.
The next graph belongs to $f(x)=\frac1x$. This graph has the $x$-axis as an asymptote. This means that as the $x$-value gets larger, the $y$-value gets closer and closer to zero.
The graph on the left below belongs to $f(x)=\sqrt x$. Just put some values for $x$ in and check the resulting points; for instance, check $(1,1)$, $(4,2)$.
The periodic graph on the right below is the graph of the tangent function: $f(x)=\tan(x)$.
-
Write the definition of an asymptote.
HintsHere you see an example: the function $f(x)=\frac1x$, with the $x$-axis as a horizontal asymptote and the $y$-axis as a vertical asymptote.
The tangent function has vertical asymptotes too.
SolutionWhat is an asymptote?
An asymptote is an invisible line which a curve, i.e. the graph of a function, comes closer and closer to but will never touch.
For example, consider $f(x)=\frac1x$.
Putting increasing values in $f(x)$ for $x$ gives:
- $f(1)=1$
- $f(2)=\frac12=0.5$
- $f(3)=\frac13$
- ...
- $f(10)=\frac1{10}=0.1$
- ...
- $f(100)=\frac1{100}=0.01$
Thus the $x$-axis is a horizontal asymptote of the corresponding graph.
-
Determine the corresponding function equation.
HintsIf you see a v-shape, then it must be an absolute value function.
You can also check asymptotes.
Both v-shapes are only moved up or down.
Pay attention to the reverse v-shape of the green graph.
You can also check some points lying on the graph.
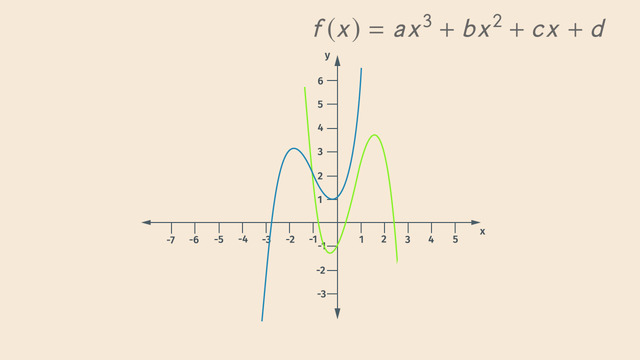
SolutionBoth graphs on the right have a v-shape. So they belong to absolute value functions.
The green one has the vertex at $y=4$. This graph is a reverse v-shape. Thus we have the function $f(x)=-|x|+4$.
In a same manner we can handle the red graph: The vertex lies at $y=2$ and it's a direct v-shape. This gives us $f(x)=|x|+2$.
Next we look at the graphs with asymptotes: the pink one and the purple one.
The pink one is symmetric about the $y$-axis, with asymptotes at $y=0$ and $x=0$. So this must be the function $f(x)=\frac1{|x|}$.
For the purple graph, we can see that the point $(1,2)$ lies on it and has asymptotes at $y=0$ and $x=0$. The function with these characteristics is $f(x)=\frac2x$.
-
Explain the expressions' domain and range.
HintsThe domain is the set of all possible values for $x$. Check if there exists any values for $x$ which you can't put in the function equation.
The range is the set of all possible function values.
Let's have a look at the following example: $f(x)=x^2$.
You can square any $x$-value, thus the domain is $D=\mathbb{R}$, all real numbers.
But independent of which value for $x$ you put in $f(x)$, the function value is greater than or equal to zero. So the range is $R=\{y~|~y\ge 0\}$.
SolutionTo find the domain, we have to see which values of $x$ can we put in $f(x)$ to get a well-defined output. For the range we have to determine all possible function values.
$\begin{array}{l|c|c|c|c|c} F(x)=\rightarrow & |x| & ( \frac1x ) & \sqrt{x} & \sin{x} & \cos{x} \\ \hline \text{Domain:} &\mathbb{R} & x~|~x\in\mathbb{R};~x\neq 0 & x \ge 0 & \mathbb{R} & \mathbb{R} \\ \hline \text{Range:} &f(x) \ge 0 & \mathbb{R}, f(x) \neq 0 & f(x) \ge 0 & -1 \le f(x) \le 1 &-1 \le f(x) \le 1 \end{array}$
$~$
- Let's start with $f(x)=|x|$. Sure we can put each real number in for $x$. Thus $D=\{x~|~x\in\mathbb{R}\}$. The absolute value is defined as the distance of any number to zero and so it's positive for any $x\neq 0$. The absolute value of $|0|=0$. This gives us the range $R=\{y~|~y\ge 0\}$.
- Next $f(x)=\frac1x$. Dividing by zero isn't possible at all. So we have to exclude $0$ from the domain: $D=\{x~|~x\in\mathbb{R};~x\neq 0\}$. The function $f(x)=\frac1x$ gives us any real number except $0$, because $\frac1x\neq0$ for all $x$. So we can conclude that also the range is $R=\{y~|~y\in\mathbb{R};~y\neq 0\}$.
- The radical is the inversion of the square. The domain of $f(x)=\sqrt x$ is given by $D=\{x~|~x\ge 0\}$. The range is the set of all real number either positive or equal to zero: $R=\{y~|~y\ge 0\}$.
- Last we investigate $f(x)=\sin(x)$ and $g(x)=\cos(x)$. For both of those functions we can put in any real number, so $D=\{x~|~x\in\mathbb{R}\}$. Looking at the graphs above we see that the maximum function value of both functions is given by $1$ and the minimum by $-1$. This gives us the range $R=\{y~|~-1\le y\le 1\}$.
-
Describe how to draw the graph of a function.
HintsHere you see the graph belonging to $f(x)=|x|$.
The domain is $D=\{x~|~x\in \mathbb{R}\}$ and the range $R=\{y~|~y\ge 0\}$.
The horizontal axis is called the $x$-axis and the vertical one the $y$-axis.
Given a function, for each $x$ there exists one $y=f(x)$.
SolutionIf you have any function you can draw its graph into an $(x,y)$-coordinate system. The $x$-axis is the horizontal axis while the $y$-axis is the vertical axis.
Each function has a domain, the set of all possible inputs, the $x$-values, and a range with all possible function values, the $y$-values.
If you'd like to check if a graph could belong to a function you can perform the vertical line test: each line parallel to the $y$-axis has at most one point in common with the graph.
-
Examine the domain, range, and asymptotes of the functions.
HintsAn asymptote is an invisible line such that a curve, or graph of a function, comes closer and closer to it but will never touch it.
You can find the range of a function if you know its asymptotes.
Solution$f(x)=\frac{x+1}x=1\frac1x$
- The denominator cannot equal zero, so $D=\{x~|~x\in\mathbb{R},~x\neq 0\}$.
- With $f(x)=1+\frac1x$, we can see that $y=1$ is the asymptote.
- Looking at $1+\frac1x=1$, we can see that $\frac1x=0$, which is not possible. So $R=\{y~|~y\in\mathbb{R},~y\neq 1\}$.
- The denominator cannot equal zero, so $D=\{x~|~x\in\mathbb{R},~x\neq -1\}$.
- Putting increasing values (either negative or positive) in for $x$, we see that $y=1$ is the asymptote.
- Looking at the equation $\frac{x}{x+1}=1$, we can see that $x=x+1$ or $0=1$, which are not possible. So $R=\{y~|~y\in\mathbb{R},~y\neq 1\}$.
- $D=\{x~|~x\in\mathbb{R},~x\neq 0\}$.
- The asymptote is $y=0$.
- $R=\{y~|~y\in\mathbb{R},~y\neq 0\}$.
- The denominator cannot equal zero, so $D=\{x~|~x\in\mathbb{R},~x\neq 1\}$.
- Putting increasing values (either negative or positive) in for $x$ we see that $y=-1$ is the asymptote.
- Looking at the equation $\frac{x+2}{-x+1}=-1$, we can see that $x+2=x-1$ or $2=-1$, which are not possible. So $R=\{y~|~y\in\mathbb{R},~y\neq -1\}$.


Well explained. The story could be different though.
Wow... That's really helpful.