Convert between Tables, Graphs, Mappings, and Lists of Points


Basics on the topic Convert between Tables, Graphs, Mappings, and Lists of Points
A function is a particular kind of relation between sets. A function takes every element x in a starting set, called the domain, and tells us how to assign it to exactly one element y in an ending set, called the range. We can represent functions in different ways; let’s take a look at a few of them through the following example:
At a stationary supply store, one pen costs $2.75. So the price the customer pays depends on how many pens they decide to buy. We can represent the amount the customer needs to pay with the function p(x)=2.75x. We have that the domain is the number of pens x the customer buys and the range is the amount the customer has to pay, 2.75x. Let’s look at some ways in which we can represent p(x):
One way of representing p(x) is via a mapping diagram. A mapping shows how the elements of the domain and range are paired. It’s a flow chart consisting of two parallel columns, showing the input x (first column) and output y (second column) values. Lines or arrows are drawn from domain to range, to represent the relation between any two elements. So for our example we would map 1 to 2.75, 2 to 5.50, 3 to 8.25, 4 to 11.00, 5 to 13.75, and so on.
We can also use tables, ordered pairs, and graphs to represent p(x). The easiest way to make a graph is to begin by making a table containing inputs and outputs. We would then call (x,p(x)) an ordered pair where x is the input and p(x) is the output. For our example, we can write the data from such a table as ordered pairs: (1, 2.75), (2, 5.50), (3, 8.25), (4,11.00), and (5,13.75). These ordered pairs can be plotted and lines can be drawn between them to get a graph.
Interpret functions that arise in applications in terms of the context.
CCSS.MATH.CONTENT.HSF.IF.B.4
Transcript Convert between Tables, Graphs, Mappings, and Lists of Points
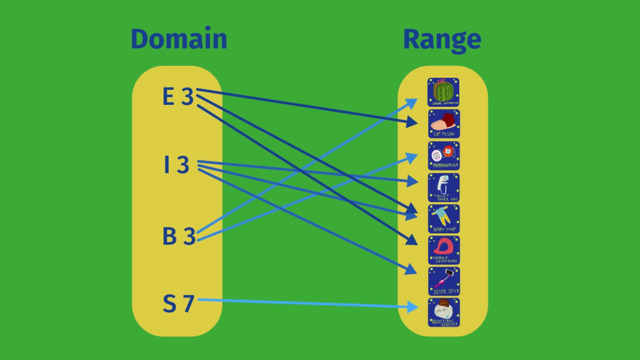
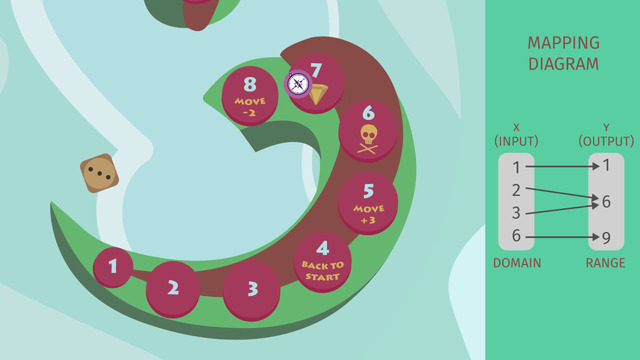
Emilia and Oscar are playing a board game called The Joyous Journey when Oscar gets a call. Seizing the opportunity, Emilia rolls the dice and deftly moves her game piece. When Oscar returns from his call, he notices something fishy SOMEHOW, Emilia ended up on a space where she gets a bonus card! Oscar asks Emilia where her turn started and what she rolled to land on this space. Conveniently, Emilia doesn't seem to remember those details anymore, but she does remember she rolled a 3. Oscar decides to examine the game board a bit more carefully.
Mapping Diagram
We can use a mapping diagram to help us visualize the situation. We know Emilia ended up on space 7 and that she moved forward. If Emilia started at the first space and rolled a 3, she would have ended up at space 4, but space 4 sends a player back to the start so she would still be at the first space. We can show this relation by drawing an arrow that starts at our input, 1, and ends at our output, 1.
So Emilia didn't start at the first space, what about the second? Since she rolled a 3, she would have gone to space 5. But space 5 moves the player 3 additional steps forward. This brings us to space 8. Space 8 moves a player back 2 steps, which finally ends our journey at space 6 where you have to take a though-card. So an input of 2 gives us an output of 6. We can show this by drawing an arrow beginning at the input, 2, and ending at the output, 6. Starting at space 3 and rolling a 3 also leads to space 6.
And since space 4 sends a player back to space 1, it’s not possible that this space was Emilia's starting point. Space 5 isn't a possibility because it sends a player 3 spaces forward to space 8, and space 8 sends a player 2 spaces back. Emilia's chances are running out. Oscar looks at the last possible starting point, space 6; rolling a 3 would lead to space 9.
All input-values, also called x-values, are called the domain. And all output-values, also called y-values, are called the range. In this example, the domain is {1,2,3,6} and the range is {1,6,9}. Since there is exactly one output for every possible input this relation is a function.
Putting the Data in Table and Graph Form
This is not the only way to show these things, however. We can group these inputs and outputs into ordered pairs, which also allows us to put the data in table and graph form. For our first input, we have 1 and from our mapping diagram, we see that the output is also 1. The ordered pair for this is (1, 1). Our second input, 2, has an output of 6. This ordered pair is (2, 6). Think you're getting the hang of it? Our third input, 3, also has an output of 6, making its ordered pair (3, 6). And our final ordered pair is (6, 9).
To show this relationship in a table, we write all the x-values to the left and the corresponding y-values to the right. Our graph, however, is arranged a bit differently. Our inputs are our x-values and our outputs are our y-values. This gives us our points on the graph.
Oscar's upset because it's obvious Emilia cheated to get to the lucky space. But did Oscar play fair?
Convert between Tables, Graphs, Mappings, and Lists of Points exercise
-
Determine to which positions Emilia could have started.
HintsUse the board game.
An input can't have two different outputs, but it is possible for two different inputs to have the same output.
SolutionIf Emilia started at the first space and rolled a $3$, she would have ended up at space $4$, but space $4$ sends a player back to the start so she would still be at the first space. We can show this relation by drawing an arrow that starts at our input, $1$, and ends at our output, $1$.
So Emilia didn't start at the first space...what about the second? Since she rolled a $3$, she would have gone to space $5$. But space $5$ moves the player $3$ additional steps forward. This brings us to space $8$. Space $8$ moves a player back $2$ steps, which finally ends our journey at space $6$...where you have to take a though-card. So an input of $2$ gives us an output of $6$. We can show this by drawing an arrow beginning at the input, $2$, and ending at the output, $6$.
Starting at space $3$ and rolling a $3$ also leads to space $6$. And since space $4$ sends a player back to space $1$, it’s not possible that this space was Emilia's starting point.
Space $5$ isn't a possibility because it sends a player $3$ spaces forward to space $8$, and space $8$ sends a player $2$ spaces back.
Oscar looks at the last possible starting point, space $6$; rolling a $3$ would lead to space $9$.
-
Explain how to represent the input and output of a function with a graph.
HintsKeep the order of pairs in a coordinate system in mind.
Here is a table representing the possible moves Emilia could have made in her board game with Oscar.
From the table, we can see that starting at position $3$ leads to an ending position of $6$.
An example of an ordered pair is $(3,6)$.
SolutionFor a graph we draw a coordinate system with a $x$- and a $y$-axis.
You can see such a coordinate system in the picture.
The input is represented by the $x$-values and the output is represented by the $y$-values. So we can draw each ordered pair $(x,y)$ into the coordinate system.
-
Plot the given points in a graph.
HintsKeep the order of the coordinates in mind.
For example, with $(3,7)$, you have the line $x=3$ parallel to the $y$-axis and the line $y=7$ parallel to the $x$-axis. The intersection of those lines is the point $(3,7)$.
The horizontal axis is the $x$-axis, while the vertical axis is the $y$-axis.
The number of pairs given by the table is five.
SolutionFrom the table,
$\begin{array}{c|c} x&y\\ \hline 1&1\\ 3&2\\ 5&3\\ 7&3\\ 8&4 \end{array}$
we get the ordered pairs $(1,1)$, $(3,2)$, $(5,3)$, $(7,3)$, and $(8,4)$.
To graph these points, keep in mind that the first coordinate of an ordered pair is the $x$-coordinate. So for example, go to $x=3$ and then two steps up to get the point $(3,2)$.
For instance, to differentiate between the points, or ordered pairs, $(5,3)$ and $(3,5)$:
- $(5,3)$ lies on a line through $x=5$ parallel to the $y$-axis.
- $(3,5)$ lies on a line through $x=3$ parallel to the $y$-axis.
-
Decide which graph corresponds to which mapping diagram.
HintsYou can write each pair of input $x$ and output $y$ as an ordered pair.
The relation where each $x$ is assigned to the same $y$ is called a constant relation.
The corresponding points lie on a line parallel to one coordinate axis.
Keep the order of the coordinates in mind:
The first coordinate (the input) corresponds to the $x$-axis, while the second corresponds to the $y$-axis.
SolutionYou can write down ordered pairs for each relation given by a mapping diagram.
Let's start with the diagram on the right. You see the corresponding graph above and to the left, and can check that they match by checking the ordered pairs given by the diagram.
Next, let's look at the relation where each input is assigned to the same output, namely $3$. The corresponding graph is the one where all the points lie on a line parallel to the $x$-axis.
Now the first mapping diagram from the left gives us the pairs $(1,2)$, $(2,2)$, $(3,4)$, $(4,4)$, and $(5,6)$.
The diagram where each input is assigned to itself gives us the graph where all points lie on a line from bottom left to top right.
-
Match the image with its corresponding definition.
HintsIn a mapping diagram, the input is the domain and the output the range.
For a graph, we use a coordinate system.
An ordered pair in general is given by $(x,y)$.
SolutionTo represent any relation between an input and an output we can use different imagines.
From left to the right we have:
The mapping diagram
On the left side we have the domain, the set of all inputs, and on the right the range, where we find all possible outputs. We use arrows to show the corresponding relationships.
Ordered pairs
Using the relations represented by the mapping diagram, we can also write ordered pairs: the first position is the input $x$ and the second the output $y$.
Table
$\begin{array}{c|c} x&y\\ \text{input}&\text{output}\\ \hline 1&1\\ 2&6\\ 3&6\\ 6&9 \end{array}$
Here you see the corresponding table: row by row you see the ordered pairs. Again you can recognize the input on the left and the output on the right side.
Graphs
To represent the relation in a more visual way we use graphs: for this we draw each ordered pair $(x,y)$ into a coordinate system, where the $x$-axis stands for the input while the $y$-axis represents the output.
-
Determine the coordinates of the ordered pairs.
HintsKeep the order of the coordinates in mind.
The first coordinate is the $x$-coordinate, which corresponds to the $x$-axis, or the input.
For example, the order pairs of this graph, from left to right:
- $(1,5)$
- $(3,4)$
- $(5,3)$
- $(7,2)$
SolutionLet's start with the topmost graph:
- For $y=3$, we get $x=2$.
- For $x=4$, we get $y=5$.
- For $x=5$, we get $y=5$.
- The last point is $(7,2)$
- $(1,5)$.
- $(2,1)$
- $(3,3)$
- $(4,5)$
- $(5,7)$