Graphing Absolute Value Equations


Basics on the topic Graphing Absolute Value Equations
You probably already know that absolute value is the distance of a number from zero, and you know the basic information about absolute value such as that absolute value is always a positive number and |0| = 0. Probably you how to solve operations with absolute value, but do you know how graph absolute equations?
Family can help you learn to graph absolute value equations. You may be thinking, family, if my family could help me with my algebra problems, I wouldn’t be watching this video. Absolute value is a function, for each input there is just one output. What does this mean? The absolute value of a number has just one solution. The absolute value of -3 is only 3, there is no other correct answer.
We can use the parent functions of absolute value to understand how the graph of absolute value equations will change as the equations are modified by addition, subtraction, multiplication, and division. Told you family could help you understand how to graph absolute value equations!
To check out the V-shape of the parent function y =|x|, watch this video. If you do, I absolutely think you will learn a whole lot about graphing absolute value equations.
Represent and solve equations with absolute value.
CCSS.MATH.CONTENT.HSA.REI.D.11
Transcript Graphing Absolute Value Equations
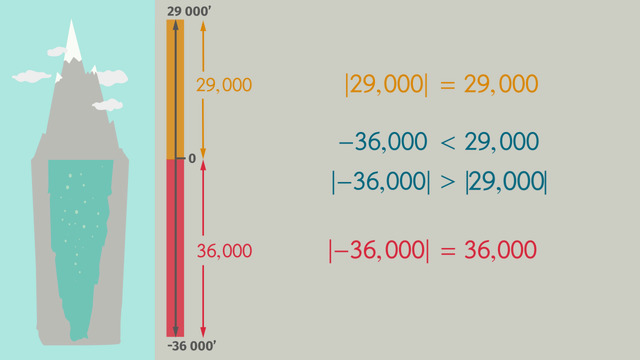
Mom is a real pool shark. She wants to teach her young son, Jimmy, everything she knows about the game. Let's take a look at how learning to graph absolute value functions can help you hit the balls into the pockets! First, let’s review a couple of concepts. We already know the absolute value of a number is the distance of the number from zero.
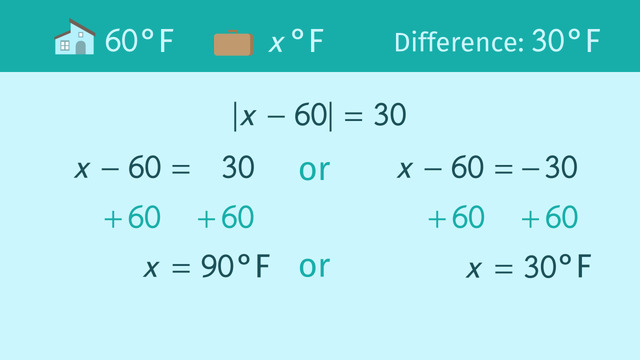
Also for the positive AND negative values of a number, the absolute value is the same. For example, the absolute value of negative one and positive one is the same: one. This number line shows the solution set for the |x| = 1. 'x' = ±1. And we know how to graph linear equations. Here's the graph of y = 3x + 2.
First absolute value function
But, when we graph the absolute value of a function, we get something totally different. Let’s start at the beginning with the simplest absolute value function, y = |x|. This is also known as the parent function for absolute value. Let's call this function "Mom". For 'x' is equal to 1, 2, 3, and so on, you get something that looks like a linear equation, but hold on, that's only one part of the graph.
Vertex and the axis of symmetry
Look what happens when 'x' = -1, -2, -3, and so on. The graph looks like a 'V'. All absolute value function graphs have a v-shape. That makes them easy to recognize, right? For absolute value graphs, the vertex is the lowest point of the graph and the axis of symmetry is the invisible vertical line that passes through the vertex.
Change the function
Let's change the Mom function and see what happens to the graph. We'll add one so that now, y = |x + 1|. Cool, the vertex moved one unit to the left, but otherwise, the graph stays the same. What do you think happens if you add 2 to 'x'? Did you guess correctly? Compared to the original "Mom" graph, the vertex moves two units to the left.
Subtraction
Let’s get a little crazy here and subtract two from 'x'… this time, the vertex moves two units to the right. D'you get the picture here? There's a pattern. Inside the absolute value bars, the opposite of the constant is the 'x' coordinate of the vertex.
Addition
Let’s change it up a bit. This time, add 1 outside the absolute value bars. How does the Mom graph change? The vertex moves up, while the rest of the graph stays the same. And, when you add two to the original "Mom" graph, the graph moves up another unit. What happens when you subtract two from the original graph? The graph moves down two units from the position of the original graph.
One last operation. Look what happens when you multiply the absolute value by two? The vertex stays the same, but the slope changes. The slope was one, and now it's two. What happens when you multiply by three? Oh look, the larger the multiplier, the more narrow the graph and the steeper the slope.
Multiplication
What about if we multiply by 1/2? Now the graph gets wider, and the slope gets flatter. Can you guess what happens when we multiply the "Mom" function by -2? Check out the graph. The v-shape flips itself over! Now that you understand how to graph absolute value functions, let’s get back to the pool table.
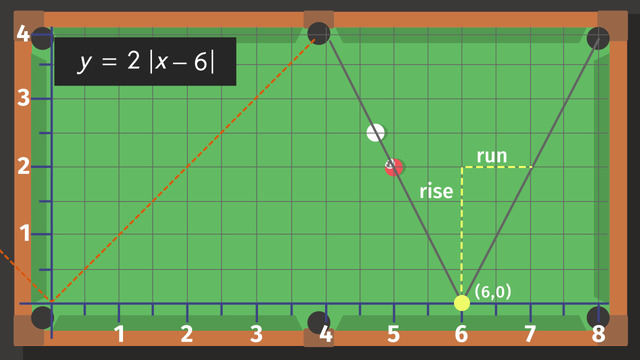
Check out the trajectory of the ball. The shape looks familiar. Right? It's a v-shape, just like the graph of an absolute value function. Let’s write an equation for the path of the ball. To do this, let's start with the Mom function, 'y' is equal to the absolute value of 'x', then add or subtract inside the absolute value bars, add or subtract outside the bars, or multiply the absolute value by a constant.
The path of the ball positions the vertex at point (6, 0). The vertex is 6 units to the right of the "Mom" graph, so inside the absolute value bars, we subtract 6 from 'x'. The 'y' coordinate indicates the graph has not moved up or down, so outside the absolute value bars, we don't need to add or subtract.
The v-shape
Now, take a look at the graph's v-shape. The v-shape is more narrow but open to the top, so we need to multiply the binomial inside the absolute value bars by a positive number. What's the slope? Check the rise over the run. It's up 2 and over 1, so the multiplier is 2. I’m not so sure if Jimmy was able to follow this explanation... He seems preoccupied with the cue chalk.
Graphing Absolute Value Equations exercise
-
Summarize the characteristics of the absolute value graph.
HintsExamine the graph above.
Starting at the origin, the graph consists of two lines:
- one is given by $y=x$ on the right
- the other is given by $y=-x$ on the left
If you flip the right part of the graph, you get the left part.
SolutionHow do you graph an absolute value equation?
Let's start with $y=|x|$. This is the parent function for all absolute value functions.
For $x=1$, $x=2$, $x=3$, the $y$-values are the same as for a linear equation. On the left side of the y-axis, however, for $x$-values that are negative like $x=-1$, $x=-2$, and $x=-3$, the absolute value is positive for the $y$-values such as $y=1$, $y=2$, $y=3$, and so on. The graph looks like a v, and all absolute value function graphs have a v-shape.
For absolute value graphs, the vertex is the lowest or the highest part of the graph, and the axis of symmetry is the invisible vertical line that passes through the vertex.
-
Explain how to determine the equation of the given absolute value function.
HintsThe graph of $y=|x+2|$ is two units to the left compared to the graph of $y=|x|$.
Think about the differences between adding or subtracting a value inside or outside the absolute value bars.
$|x|+2$ means moving up two units compared to the parent function.
SolutionWe can recognize absolute value graphs because of their v-shaped forms so we know that this is the graph of an absolute value function.
Let's start with the parent function, $y=|x|$.
As the vertex is $(6,0)$, we know to subtract $6$ inside the absolute value bars. Outside, we don't have to add or subtract any other value:
- $y=|x-6|$
- $m=\frac42=2$
- $y=2|x-6|$
-
Identify the differences between the new equations and the parent function, $y=|x|$.
Hints- adding and subtracting inside the absolute value bars $\rightarrow$ shift left or right along the x-axis
- adding and subtracting outside the absolute value bars $\rightarrow$ shift up or down along the y-axis
Shifting up or down changes the y-coordinate of the vertex.
SolutionBy starting with the parent function, $y=|x|$, we are able to determine any graph of an absolute value equation:
- adding or subtracting inside the absolute value bars results in a shift along the x-axis
- adding or subtracting outside the absolute value bars results in a shift up (adding) or down (subtracting), along the y-axis
- multiplying by a factor greater than $1$ results in a narrower graph
- multiplying by a positive factor less than $1$ results in a wider graph
- multiplying by a negative factor results in a horizontal flip of the graph
The graph of $\mathbf{y=|x|+5}$ is shifted up five with the new vertex $(0,5)$.
The graph of $\mathbf{y=5|x|}$ is narrower and the vertex stays the same $(0,0)$.
The graph of $\mathbf{y=|x|-5}$ is shifted down five with the new vertex $(0,-5)$.
-
Figure out the equation.
HintsTake a look at the vertex $(1,1)$.
Compared to the parent function, $y=|x|$, the vertex is shifted
- one unit to the left
- one unit up
SolutionAs usual, let's compare this graph with the parent function, $y=|x|$.
In our picture with the flashlight, the vertex is given by $(1,1)$.
- First, we will take a look at the x-coordinate of the vertex $x=1$. That tells us that we have to shift the function one unit to the right. We can write this as the following: $y=|x+1|$.
- Now, we can check the rise and run, or slope: we move up two units (rise) and we move three units to the right (run). So we get the factor $\frac23$. This gives us $y=\frac23|x+1|$.
- Finally, we still have to deal with the y-coordinate of the vertex, $y=1$. The graph is shifted up one unit, which means adding $1$ outside the absolute value bars: $y=\frac23|x+1|+1$.
-
Select the graph corresponding to $y=|x|+1$.
HintsAdding or subtracting any value inside the absolute value bars will shift the graph left or right along the x-axis.
Adding or subtracting any value outside the absolute value bars will shift the graph up or down along the y-axis.
Multiplying by a factor greater than $1$ leads to a narrower graph, whereas multiplying by a factor less than $1$ but more than 0 leads to a wider graph.
SolutionStarting with the parent function, $y=|x|$,
- adding or subtracting inside the absolute value bars results in a shift along the x-axis
- adding or subtracting outside the absolute value bars results in a shift along the y-axis
- multiplying or dividing outside the absolute value bars leads to a narrower or wider graph
$\mathbf{y=|x-2|}$: The graph is the parent function shifted two units to the right. This is the green graph.
$\mathbf{y=|x|+1}$: The graph is the parent function shifted one unit up. This is the red graph.
$\mathbf{y=3|x|}$: The graph is narrower than the parent graph. This is the violet graph.
$\mathbf{y=\frac12|x|}$: The graph is wider than the parent graph. This is the orange graph.
The turquoise graph is a line corresponding to the linear equation $y=3x+2$.
-
Label the absolute value equations.
HintsStart by determining the vertex of each graph in relation to the parent function, $y=|x|$.
Once you know the vertex, you know how each graph shifts:
- along the x-axis - to the left or to the right
- along thy y-axis - up or down
$m$ in $y=m|x|$ is determined by rise over run.
Use the following approach:
- determine the x-axis shift
- consider the factor if necessary
- determine the y-axis shift
SolutionLet's determine the equation of each absolute value graph by using the following steps:
- check the vertex
- determine the x-axis shift depending on the vertex
- calculate the slope by counting the rise over run
- determine the y-axis shift depending on the vertex
- the vertex is given by $(-2,1)$
- x-axis-shift: $y=|x+2|$
- $m=\frac11=1$
- y-axis-shift: $\mathbf{y=|x+2|+1}$
- the vertex is given by $(-3,0)$
- x-axis shift: $y=|x+3|$
- $m=\frac31=3$
- we have no y-axis shift
- $\mathbf{y=3|x+3|}$
- the vertex is given by $(0,2)$
- we have no x-axis shift
- $m=\frac12$
- y-axis shift: $\mathbf{y=\frac12|x|+2}$
- The vertex is given by $(2,1)$
- x-axis shift: $y=|x-2|$
- $m=\frac21=2$
- y-axis shift: $\mathbf{y=2|x-2|+1}$