Equations of Graphs of Proportional Relationships Involving Fractions


Basics on the topic Equations of Graphs of Proportional Relationships Involving Fractions
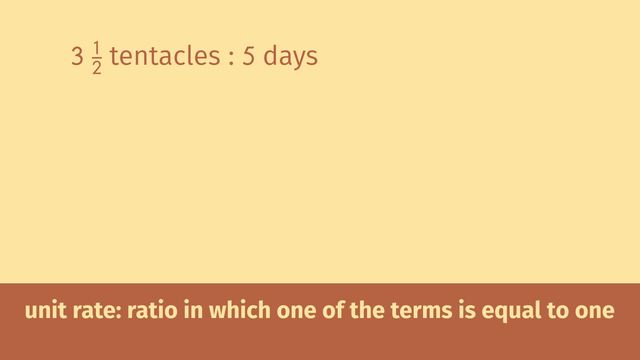
After this lesson you will be able to solve proportional relationship problems involving fractions, using tables, graphs, and equations.
The lesson begins with a review of the graphs of proportional relationships and how to writing an equation using the constant of proportionality. This leads to a method for generating a table of values, which can be verified by graphing.
Learn about proportional relationships by helping the scouts win the Cookie Combat Championships!
This video includes key concepts, notation, and vocabulary such as: proportional relationship (relationship between two equal ratios); linear relationship (represented by a line on the coordinate plane, where the slope or rate of change always stays the same); ordered pair (two corresponding values in a proportional relationship); the constant of proportionality (in a proportional relationship, the constant which is equal to the slope of the line); and origin (the point (0,0) on the coordinate plane).
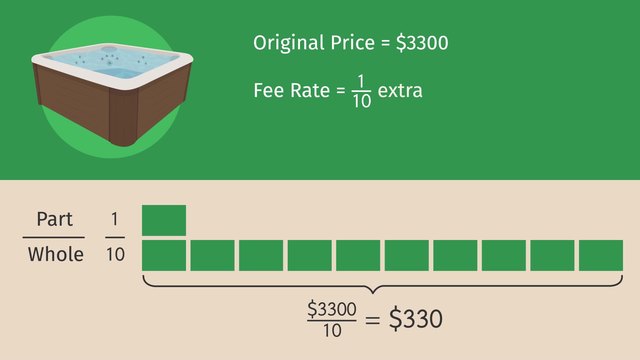
Before watching this video, you should already be familiar with complex fractions; interpreting ratios represented in tables, equations and graphs; converting between those representations; and solving part-to-part and part-to-whole problems using a variety of tools.
After watching this video, you will be prepared to learn more about scale factors and geometric representations of proportionality.
Common Core Standard(s) in focus: 7.RP.A.1, 7.EE.B.4a A video intended for math students in the 7th grades Recommended for students who are 12-13 years old
Transcript Equations of Graphs of Proportional Relationships Involving Fractions
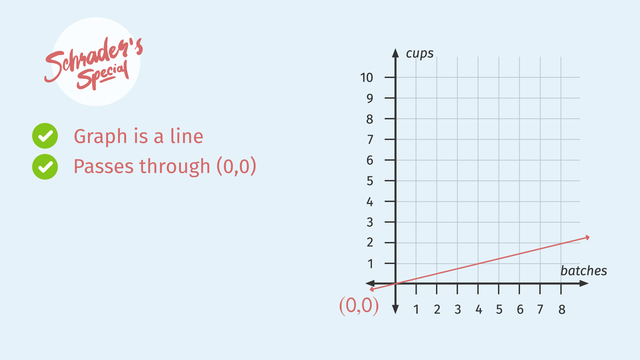
Scout Master Schrader and his Junior Scouts have prepared all year for this moment. It’s the final round of the Cookie Combat Championships, and only one troop can emerge with the trophy for the best Slim Mint cookies. Schrader’s arch-rival, Scout Master Blanco, is preparing his troops for an epic battle. Each troop has a secret and very precise recipe they follow and has exactly two hours to bake their way to victory. In the end, there can be only one winner, determined by Taste Master Gustavo. To get the proportions just right so the flavour is superior, they’ll have to use Equations and Graphs of Proportional Relationships Involving Fractions. Gustavo waves the Cookie Combat flag, and the competition begins. The graph shows the cups of mint filling required per batch of cookies. We know that the mint filling is proportional to the number of batches of cookies because this graph is a straight line, going through the origin. It has to go through the origin because if we make 0 batches of cookies, we have to use 0 cups of mint filling. The straight line means that as the batches increase, the cups of mint filling increase proportionally, at a constant rate. But how can we use this graph to get a useful equation? A graph of a proportion always reveals the constant of proportionality at the point (1, k). k' equals one-fourth. Remember, equations for proportional relationships always have the form 'y' equals 'kx'. So the equation here is 'y' equals one-fourth 'x'. This is the equation of our line. Now we’re in business! Schrader’s scouts realize that it would be easier to see how many cups of mint filling they need per batch if they made a table. To make a table which represents this proportion we can enter points directly from the graph. One, one-fourth, two, one-half, and so on. Schrader’s scouts need to make five and a half batches of cookies. How many cups of mint filling will they need? That point might be difficult to see in the graph, so let's use the equation to generate it. We can take five and a half from the table for 'x,' and use our equation to find 'y.' Substitute five and a half for 'x' in the equation. y' equals one-fourth times five and a half. Convert five and a half to an improper fraction, eleven-halves, and then multiply to get eleven-eighths, or one and three-eighths. Let’s check and make sure that point is on the line looks about right! And so Schrader’s scouts are ready to crank out five and a half batches of Slim Mints. Let’s check in on Master Blanco’s team. He’s a culinary genius actually. He uses a lot of mints, which turns the cookies blue, so he calls his cookies Blanco’s Blues. But his real secret is that he uses a very odd fractional amount of mint filling. This is his secret equation relating the batches of cookies to the cups of mint filling. Can you see the constant of proportionality? It’s right here: 'k' equals three-sevenths. We can make a table to demonstrate how radical this proportion is. We can use the equation to complete the table. For an 'x' of one, 'y' is three-sevenths. For an 'x' of two, 'y' is three-sevenths times two, or six-sevenths. For an 'x' of three, 'y' is three-sevenths times three, or nine-sevenths, and so on. Blanco's troops want to encode their secret recipe in a graph. To do so, we can use the equation to immediately plot two points. What two points should we plot? Zero, zero of course, because we know that graphs of proportional relationships always go through the origin. And let's use our equation to figure out what 'y' is when 'x' equals 7. Plugging 7 into our equation for 'x', we find that 'y' equals 3. Drawing a line which passes through these two points we can see that it looks like all of the points in our table are also on this line! They are off and running! After two hours of baking, the teams are exhausted. It's decision time. Schrader and Blanco send their troops in, armed with their slim mints, to be judged by the Cookie Master, Gustavo. Which cookies will win the day - Scrader's Specials, or Blanco's Blues? Before we hear Taste Master Gustavo’s decision, let’s review what we learned about representing proportional relationships. Graphs of proportional relationships are always straight lines through the origin. The constant of proportionality is visible at the point '1, k.' We can use 'k' to write an equation, 'y' equals 'kx'. And we can use any representation to generate any other. Use the best representation for your situation. Gustavo was blown away by the superior mint flavour of Blanco’s Blues and has declared Blanco's troop the winner! Blanco’s Junior Scouts have won this time, but Schrader’s troops have hope for the future this epic battle is sure to be continued.