What Can Statistics Be Used For?
- Unlocking the Power of Statistics in Everyday Life – Introduction
- Understanding Statistics – Definition and Significance
- Practical Applications of Statistics in Various Fields – Examples
- The Role of Statistics in Daily Decision-Making – Real-World Scenarios
- Understanding Measures of Central Tendency – Explanation
- The Impact of Statistics on Everyday Life – Summary
- What Can Statistics be Used for – Frequently Asked Questions


Basics on the topic What Can Statistics Be Used For?
Unlocking the Power of Statistics in Everyday Life – Introduction
Have you ever wondered how companies predict trends or how medical researchers determine the effectiveness of a new drug? The answer lies in the power of statistics. As a bridge between data and decision-making, statistics play an essential role in various aspects of our daily lives. From conducting surveys to interpreting results, statistics help us make sense of vast amounts of information.
Understanding Statistics – Definition and Significance
To fully grasp the concept of statistics, it is crucial to become familiar with its two key branches – descriptive statistics and inferential statistics. Descriptive statistics summarize data to give a clear picture of what has happened, while inferential statistics use that data to make predictions and draw conclusions.
Practical Applications of Statistics in Various Fields – Examples
Statistics are not just academic; they are applied in nearly every field imaginable.
| Field | Application of Statistics |
|---|---|
| Healthcare | Medical researchers use statistics to determine the effectiveness of treatments, understand risk factors for diseases, and improve patient outcomes through evidence-based medicine. |
| Business and Economics | Business analysts predict sales trends, evaluate customer satisfaction, and optimize operations. Economists rely on statistics to analyze market trends, forecast economic conditions, and develop policies. |
| Government | Statistics are used to craft public policy by analyzing social trends, demographic information, and economic data. |
| Sports | Coaches and teams analyze player performance and strategize using statistical models. |
| Everyday Life | We encounter statistics when reading about the unemployment rate, calculating the average cost of living, or interpreting the likelihood of events based on percentages. |
The Role of Statistics in Daily Decision-Making – Real-World Scenarios
Every day, we make decisions based on statistical information, sometimes without even realizing it.
Interpreting Health Information
- When we read that a certain food reduces the risk of a health condition by a percentage, we're interpreting statistical data.
Financial Planning
- Investors look at statistical trends to make decisions about where to put their money, balancing potential gains with the risk of loss.
Understanding Measures of Central Tendency – Explanation
Measures of central tendency are statistical tools that describe the center point of a dataset.
| Statistical Measure | Description |
|---|---|
| Mean | The mean is the arithmetic average, calculated by adding all the numbers and dividing by the count of numbers. |
| Median | The median is the middle value when the numbers are arranged in order. |
| Mode | The mode is the most frequently occurring value in a dataset. |
The Impact of Statistics on Everyday Life – Summary
Statistics are more than just numbers—they are a lens through which we view and interpret the complexities of our world. By understanding and applying statistical principles, we can make more informed decisions, whether we're assessing the effectiveness of a new medicine, making investment choices, or simply deciding what to eat based on nutritional information.
Stay curious and keep asking questions—it's the best way to deepen your understanding of statistics and its applications.
Key Learnings from this Text:
- Statistics is a fundamental tool for making informed decisions based on data.
- There are two main branches of statistics: descriptive and inferential.
- Statistics are applied in various fields, including healthcare, business, sports, and everyday life.
- Measures of central tendency (mean, median, mode) help summarize data.
- Understanding statistics is crucial for interpreting information accurately and making sound decisions.
Whether you are a student, a professional, or just someone interested in making sense of the world, a solid understanding of statistics is invaluable. Continue exploring other content on our platform to enhance your knowledge and skills in this critical area.
What Can Statistics be Used for – Frequently Asked Questions
Transcript What Can Statistics Be Used For?
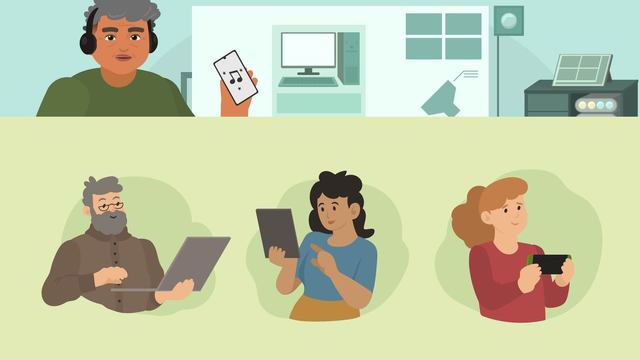
Future grandpa Luis is reminiscing on days gone by, thinking about all the technology from the past. He's suddenly intrigued by some statistical data he has found online about his generation, but Grandpa Luis has a lingering question; What can statistics be used for? You may have come across statistics before, on social media asking for your opinion, on the news, or in scientific data to back up claims. But what exactly are statistics? Statistics is the science of collecting, organizing, analyzing, and interpreting data. Its purpose is to help us understand and make sense of the information we gather. When looking at statistics, you will often come across the term population. Population is the entire group of individuals or objects that we are interested in studying. For example, Grandpa Luis found some statistics about the screen time habits across different generations in the USA, so the population is all the people in the USA. However, it is often not possible to collect data from an entire population due to time, cost, or logistical constraints. This is where a sample comes in! A sample is a smaller group selected from the population that we study in order to make inferences about the larger population. Imagine trying to find the screen time habits of every person in the USA. This would be a massive task, so instead you would select a representitive sample; a smaller group of people from each generation that accurately represent the larger population. But why is having a representative sample so important? Well, if we want to make valid inferences about the entire population based on our sample, it's crucial that the sample accurately reflects the population's characteristics and diversity. Let's consider the statistics Grandpa Luis came across, which was on screen time habits across different generations. We would probably want to know if there are any differences in the average time spent on screens between Boomers, Generation X, Millennials, Generation Z. This graph shows the results of a survey conducted on a sample of individuals from multiple generations. By analyzing this sample, we can draw conclusions about the entire population of diverse generations. But remember, generalizations about a population from a sample are only valid if the sample is representative. If the sample consists mainly of individuals who spend an excessive amount of time on screens, this wouldn't accurately represent the entire population. So, how do we ensure a sample is representative? By using random sampling, which is a method of selecting individuals for a sample in a way that every member of the population has an equal chance of being chosen. By using random sampling, we can reduce biases and ensure our sample reflects the diversity of the population. This helps us make more reliable and valid inferences. Another important consideration is sample size. Sample size is simply the amount of people that are used in a sample. The larger the sample size, the more reliable data tends to be. So a large sample size is usually better. To summarize, statistics can be used to gain information, draw conclusions, and make inferences about a population by examining a representative sample. Generalizations about a population from a sample are only valid if the sample accurately reflects the population's characteristics. Random sampling plays a crucial role in producing representative samples, reducing biases, and supporting valid inferences. Statistics are a powerful tool that helps us understand the world around us. And what about Grandpa Luis? He concluded that his generation were lucky to have access to such great technology growing up!
What Can Statistics Be Used For? exercise
-
What can statistics be used for?
HintsStatistics is a science which looks at data.
For that to happen it needs to be collected first.
When you have collected your data, you need to be able to present it so you can understand what it is telling you.
Look at the other words which support this.
There are $4$ correct answers.
Solution- Collecting data
- Analyzing data
- Organizing data
- Interpreting data
-
Why collect a sample?
HintsThe 'population' is the total amount of people in a survey.
For example, if we wanted to ask the whole school a question then the school would be the population.
A sample can be taken instead. Which is a cross section of the students who would represent the whole population.
If we only ask a sample we would save a number of things.
Here is a picture clue to some of the answers missing above.
- Saves money - it is cheaper.
- Saves time - it is quicker.
SolutionUsing a sample instead of asking the opinion of the whole population has a number of advantages. Firstly it is cheaper as it does not cost as much to ask a sample.
It saves time asking a sample as it would take longer to ask everyone in the population. To ask everyone we would need to employ more staff which would also cost more.
-
What size should the sample be?
HintsA random sample has to be representative of the population of $800$.
Not too many, as Tommy could have asked the whole school.
To be representative of the school there has to be enough people asked in order to reflect this.
A good example of a sample size would be around $10$ out of a population of $50$, or $200$ out of $1000$.
Approximately $20$% of the population is a good estimate for a sample size.
Solution$\mathbf{100}$
This is a good number to use as a sample.
$5$ and $10$ is much too small and $600$ is nearly the whole population.
-
How do we use statistics?
Hints- We start by collecting data
- We get this by surveys, questionnaires etc.
- This data collected should then be organized into a readable format.
- Questionnaires to collect the data
- Organize into a spreadsheet
- Next comes the analyzing and interpreting.
The very last part of this is interpreting the data you have collected to see if it supports your initial theory.
SolutionCollecting - Send out questionnaires.
Organizing - Enter data into a spreadsheet and put into a graph.
Analyzing - Check out the results that the data is showing.
Interpreting - Finally, do these results help prove what we were looking for, or otherwise?
-
Using graphs to organise data.
HintsEach way of organizing data does what it says in the title.
For example, a pie chart is circular and looks like a pie.
A bar chart has multiple bars to represent the data and a line graph uses lines.
A scatter graph has data points which look like they have been scattered on the axes.
SolutionHere we can see the graphs alongside their correct names.
-
What is a random sample?
HintsA random sample is a representative sample where everyone has an equal chance of being chosen.
A random sample can be generated by a calculator, a computer or numbers can be picked out from a hat.
Everyone has to have an equal chance!
There are three correct answers here.
SolutionDoug gives every address in the town a number and generates random numbers using his computer
Doug uses postcodes and the computer sends out surveys to random addresses
Doug uses the names of all the people in the town from the town hall census. He randomly generates the sample names to ask.
- If Doug asks his family or football team mates that is biased.
- If Doug asks the whole town that is not a sample but the 'population'.
- If Doug stands outside the supermarket he would not be giving everyone in the town an equal chance of being picked.
- If Doug uses the old list of people from $2001$ some of them could have moved or died and others may have been born.