Graphing Linear Inequalities


Basics on the topic Graphing Linear Inequalities
After you have mastered writing and graphing linear equations, it’s time to move on to writing and graphing linear inequalities. This starts out the same as graphing linear equations but quickly veers into new territory.
Just like graphing an equation, to graph a linear inequality, first manipulate the inequality so it’s in slope-intercept form, y = mx + b, by using opposite operations and isolating the y-value. But, different from equations, don’t forget to pay attention to any needed sign changes. If you multiply or divide by a negative number, remember to flip the sign. Once you have done that, using the y-intercept as your first point, use the slope to draw in additional points.
Before you draw a line to connect the dots, take a look at the inequality symbol, for less than or greater than – use a dotted line. For less than and equal to and greater than and equal to – use a solid line. Now shade in the solution set. As a rule, greater than is above the line, and less than is below the line but depending on the slope of the line, this may not be so obvious, so pick a test point and verify that the solution set works before you highlight the area in permanent ink. To see some real world uses of linear inequalities and learn some tips to make graphing easier, take a look at this fun video.
Write equations of the line.
CCSS.MATH.CONTENT.HSG.GPE.B.5
Transcript Graphing Linear Inequalities
Lately, but possibly everyday, My Dear Aunt Sally has been so forgetful. For my birthday, she baked 15 cookies, trimming them with edible gold leaf, and she squeezed a bowl of lemons to make 10 glasses of lemonade, but then my mom reminded her that my birthday is not till next month.
Rather than toss the tasty treats, she decides to sell them. At the very least, she wants to recover the 50 dollars she spent on ingredients. So, how much should she charge for each treat? Let's help her.
Write a Linear Inequality in Slope-Intercept Form
Prior to evaluating My Dear Aunt Sally’s problem, let's write a linear inequality in slope-intercept form, then graph the inequality to determine the solution set.
What are the facts? Aunt Sally wants to sell 15 cookies and 10 glasses of lemonade. She needs to collect at least 50 dollars, so we should write the inequality using the greater than or equal to symbol.
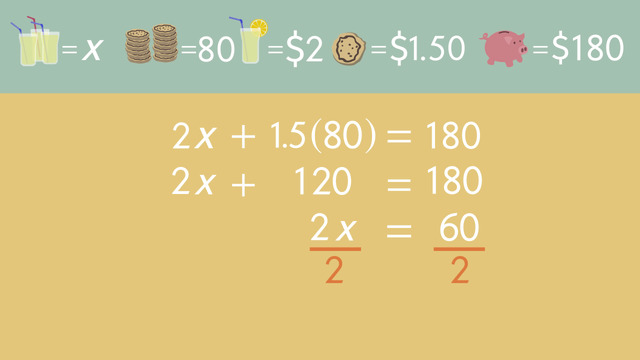
The sum of 15 cookies for an unknown price, x, plus 10 glasses of lemonade for an unknown price, y, has to be greater than or equal to 50 dollars.
To put this in slope-intercept form, we have to move the terms around. First, using the opposite operation, move 15x to the other side of the inequality. Next, isolate the y by dividing both sides by ten.
Do we need to flip the inequality sign? No, since we're dividing by a positive number, we’re ok. Always remember to check the sign because if you multiply or divide by a negative number, you'll need to flip it.
Okay, where are we? Right, y ≥ −1.5x + 5. We're good to go!
Graphing a Linear Inequality in Slope-Intercept Form
Now that the inequality is in slope-intercept form, let’s graph it! The y-intercept is 5, and the slope is negative one point five. We know how to draw the line to indicate equal to but how do we represent greater than?
All the ordered pairs above the line will result in an answer that is greater than the equation we set up. Let’s shade this area.
To be certain this is correct, let’s check our work. Pick a point on the graph, any point. How about the ordered pair 1, 3? This point is below the line.
Will Aunt Sally collect 50 dollars or more if she sells 15 cookies for 1 dollar each and 10 glasses of lemonade for 3 dollars each? Do the math.
The product of 1 and 15 plus the product of 3 and 10 is equal to 45. No, this price plan won’t work and no wonder, the point 1, 3 is not in the area of values we shaded!
Any point along the line or in the shaded area will give Aunt Sally the pricing combo she needs to earn fifty dollars or more – that is, if she sells all of the tasty treats.
More Examples Graphs of Inequalities in Slope-Intercept Form
Now that you understand the concept, let’s look at some other inequalities and their graphs.
- For y is less than or equal to x plus 2, notice the shaded area is below the solid line. All values on and below this line are in the solution set.
- For y is greater than negative one-half x plus five, we use a dashed line as, the values on the line are not part of the solution set. Only the values above the dotted line solve the inequality.
- For y is less than negative x plus 4, we have to use a dashed line; but this time, the values below the dashed line are in the solution set.
Let’s make a graphic organizer to help you remember.
- For y is greater than or equal to, the line is solid, and the values on and above the line satisfy the inequality.
- For y is less than or equal to, the line is solid, and the values on and below the line are part of the solution set.
- For y is greater than, we must use a dashed line, and only the values above the line are part of the solution set and lastly, for y is less than, the line is dashed and only the values below the line satisfy the inequality.
Summary: Steps to Solve Linear Inequalities by Graphing
Let’s summarize the steps to solve inequalities:
- Write your equation in slope-intercept form.
- While isolating the variable, if needed, flip the inequality symbol.
- Draw the appropriate line, solid or dashed.
- Determine if the solution set includes the area above or below the line, then pick any point and check your work.
Predictably excited, My Dear Aunt Sally sold all of the cookies and all the glasses of lemonade! She’s ecstatic, but wait. You won’t believe this! It’s Aunt Sally’s birthday! How did she forget her own birthday?!
Graphing Linear Inequalities exercise
-
Decide which graph describes the given situation.
HintsFirst, have a look at the line. Does the line correspond to the inequality $y=-1.5x+5$?
For $\ge$ or $\le$ situations, the line is solid otherwise it needs to be dashed.
- $\ge$ or $>$ will give us solutions above and
- $\le$ or $<$ beyond the line.
SolutionThe inequality
$y\ge -1.5x+5$
is written in slope-intercept form.
To graph, draw the line of the equation $y=-1.5x+5$ on a coordinate grid :
- this line passes the y axis at $y=5$ and
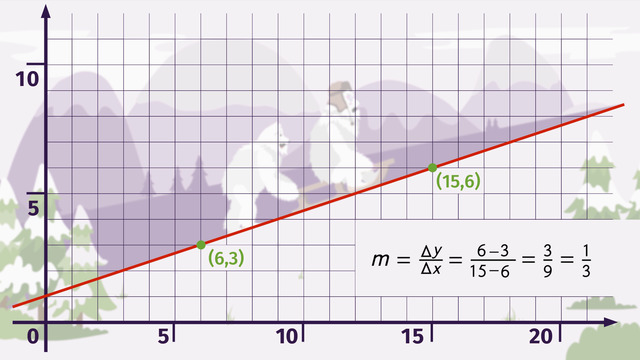
- the slope is $m=-1.5$. So for each one step to the right we go 1.5 steps down.
- the line is solid, and
- the solutions lie above the solid line.
-
Determine which graph corresponds to which inequality.
HintsFirst, take a look at the lines.
Are the lines solid ($\le$ or $\ge$) or dashed ($<$ or $>$)?
SolutionGraphing linear inequalities:
- First, we draw the line corresponding to the equation $y=mx+b$.
- Next, we look at the inequality sign:
- $\ge$ $\rightarrow$ solid line and the solutions lie above the line
- $>$ $\rightarrow$ dashed line and the solutions lie above the line
- $\le$ $\rightarrow$ solid line and the solutions lie beyond the line
- $<$ $\rightarrow$ dashed line and the solutions lie beyond the line
- the violet one belongs to the equation $y=-1.5x+6$ which is not given and
- the turquoise one belongs to the inequality $y<x+2$.
- The red graph belongs to the inequality $y\ge -1.5x+5$.
- The green graph belongs to the inequality $y\le x+2$.
- The blue graph belongs to the inequality $y> -\frac12x+5$.
- The orange graph belongs to the inequality $y<-x+4 $.
-
Decide which values would earn aunt Sally enough money.
Hints$x$ is the price for one cookie, and $y$ represents the price for one glass of lemonade.
Plug the prices into the inequality:
$15\times x+10\times y\ge 50$
and check if Aunt Sally met her goal.
Remember that the inequality shown is greater than or equal to.
SolutionEach combination of the prices for the cookies and lemonade can be drawn as a point on the coordinate graph. Just have a look at the picture on the right.
The price for one cookie is represented by $x$, and the price for one glass of lemonade is represented by $y$. Therefore, you have to look at the x and y axis to find a suitable combination.
$\mathbf{x=2,~y=2}$. You can see this point is plotted on the line:
$15\times 2+10\times 2=30+20=50$. Aunt Sally needs to earn $50, so she is satisfied with her earnings.
$\mathbf{x=1.2,~y=2.5}$. This point below the line. Therefore, it doesn't meet aunt Sally's goal of earning at least $\$50$. $15\times 1.2+10\times 2.5=18+25=43<50$.
$\mathbf{x=3,~y=1.5}$. You can see this point lies above the line:
$15\times 3+10\times 1.5=45+15=60$. This is more than the $\$50$ Aunt Sally had hoped to earn. She will be very satisfied with her earnings.
-
Decide which graph corresponds to the given inequality.
HintsFirst, write the inequality.
You'll get: $12\times x+10\times y\ge 30$.
Rewrite this inequality into an equation in slope-intercept form.
The equation describing the line is:
$y=-1.2x+3$.
SolutionLet's have a look at the inequality :
$12\times x+10\times y\ge 30$.
We rewrite this inequality as an equation in slope-intercept form: $\begin{array}{rcl} 12 x+10 y&\ge& 30\\ \color{#669900}{-12x} && \color{#669900}{-12x}\\ 10y&\ge&-12x+30. \end{array}$
Now we divide by $10$: $y\ge -1.2x+3$.
We draw theline corresponding to $y=-1.2x+3$.
- Because of the $\ge$ sign this line is solid and
- because of greater or equal to sign the solutions lie above this line.
-
Summarize how you can recognize the solution depending on the inequality sign.
HintsIf the points on the line are also solutions, you can recognize this by a solid line otherwise a dashed line.
If the points on the line are also solutions, the corresponding inequality sign is $\ge$ or $\le$.
Greater corresponds to above the line.
SolutionJust remember the solutions depending on the relation sign:
- $\ge$ $\rightarrow$ solid line and the solutions lie above the line.
- $\le$ $\rightarrow$ solid line and the solutions lie beyond the line.
- $>$ $\rightarrow$ dashed line and the solutions lie above the line.
- $<$ $\rightarrow$ dashed line and the solutions lie beyond the line.
- Greater than or less than as well as equal $\rightarrow$ solid line and dashed line otherwise.
- Greater than or greater than or equal to $\rightarrow$ above the line and beyond otherwise.
-
Decide if the given points lie within the area described by the inequalities.
HintsDraw the lines corresponding to $y=x+3$ and $y=x+1$ into a coordinate system.
Hint: these lines are parallel.
There's no point that's a solution to both inequalities.
Pay attention to the different signs of the inequalities.
SolutionThe shaded areas of the graph on the right shows the solution for two inequalties.
The solid red line belongs to the equation $y=x+1$, the dashed one corresponds to $y=x+3$. These lines are parallel.
The solutions of $y\le x+1$ lie in the red area, and those of $y>x+3$ in the green area. Remember that the points on the green line don't belong to the solution set.
So the point on the green line as well as both points between the two lines don't belong to either inequality.
The point $(0.5,4.5)$ are a solution to the inequality $y>x+3$.
All the other points, including $(1,2)$ lying on the red line, are solutions to the inequality $y\le x+1$.