Box-and-whisker plots


Basics on the topic Box-and-whisker plots
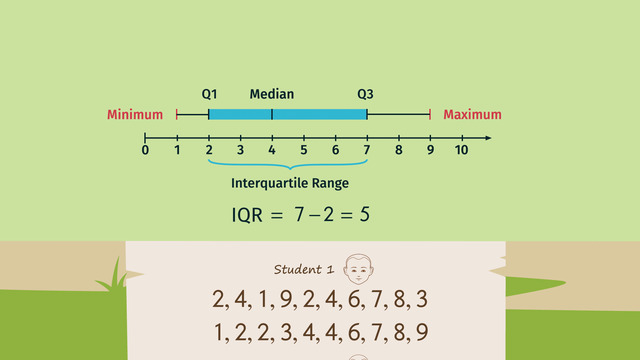
A box-and-whisker plot is a quick way of showing the variability of a data set. It displays the range and distribution of data along the number line.
To make a box-and-whisker plot, start by ordering the data from least to greatest. Next, inspect the ordered data set to determine these 5 critical values: minimum, Q1, median, Q3, and maximum and plot them above a number line.
The minimum and maximum values are the least and greatest values. The median or middle value splits the set of data into two equal numbered groups. The first quartile, Q1, is the median of the lower half of the data set. The third quartile, Q3, is the median of the upper half of the data set.
The box is created by drawing vertical line segments through Q1, median, and Q3 and drawing two horizontal line segments connecting the endpoints from Q1 to Q3 passing through the median. The first whisker is created by drawing a horizontal line connecting the minimum and Q1 while the second whisker is created by drawing a horizontal line connecting Q3 with the maximum.
A good measure of the spread of data is the interquartile range (IQR) or the difference between Q3 and Q1. This gives us the width of the box, as well. A small width means more consistent data values since it indicates less variation in the data or that data values are closer together.
Summarize and describe distributions.
CCSS.MATH.CONTENT.6.SP.B.4
Transcript Box-and-whisker plots
Deep in the mountains lies a martial arts school at 1 Foot Fist Way that focuses on breaking wooden planks. All of the students must break as many wooden planks as they can in one strike. Each student records his number and presents it to his master at the end of the week. The most consistently good student does not have to clean the school for one week. But how can the students' master tell which of his students are most consistently the best? By using Box-and-Whisker Plots, of course!
Using Box-and-Whisker Plots
If we want to put the students' data into a box-and-whisker plot, we need to have the numbers in order. Looking at student 1's record for the week, he has yet to order his list. After ordering the lists, we need to find 5 critical values: the minimum, the first quartile (also known as Q1), the median, the third quartile (also known as Q3), and the maximum.
Student 1
Heeding his teacher's instructions, student 1 orders his list. The minimum, or the smallest number, for student 1 is 1. Student 1's maximum, or the largest number, is 9. Next, let's find the median. The median is the middle number in the data set. Because we have an even number of data points, there are two middle numbers. When this happens, you should take the average of the two middle numbers. In this case, the average of 4 and 4 is 4. So now we know the minimum is 1, the median is 4 and the maximum is 9. To find each quartile, we must split the data into halves.
Q1 is the median of the first half of the data 1, 2, 2, 3, 4. The middle number of this portion of the data is 2, so the Q1 is 2. Q3 is the median of the second half of the data 4, 6, 7, 8, 9. The middle number is 7, so the Q3 is 7.
Now that we have all 5 values, we can draw the box-and-whisker plot on our number line. Always plot the minimum, Q1, median, Q3, and maximum values The box part of the box-and-whisker plot is drawn with a vertical line through both the Q1 and Q3 values. These are then connected to form our box.
Finally, we also need to draw a vertical line in the box to represent the median. The Interquartile Range orIQR is obtained by substracting Q1 from Q3. In the case of student 1 this is 7 minus 5 or 2. The whiskers are then drawn to connect the box to the minimum and maximum values.
Student 2
Now let's look at student 2. First let's put the numbers in order. Now we need to find the 5 critical points again. Here, the minimum is 1 and the maximum is 8. Now let's find the median. Again, we have an even number of data points, this means we will have two middle values. The two middle values are 5 and 5, which when averaged, gives us 5. Now, we can split the data into halves in order to find Q1 and Q3.
The first half of the data is 1, 1, 2, 3, 5. So the Q1 is 2 because 2 is the median of the first half of the data. The second half of the data is 5, 6, 6, 8, 8. 6 is the median value in this portion of the data, so Q3 is 6.
Now that we have our five points, we can make a box-and-whisker plot. We draw a box from Q1 to Q3.Then, we make the whiskers by drawing lines from each end of the box to connect the minimum and maximum values.
Student 3
Let's put the data from student 3 in order. This diligent disciple has already completed his box-and-whisker plot! Let's check to see if all the parts are there. The minimum is 0, the maximum is 9... This time, even though the two middle numbers are different, we still just need to take the average. So, our median is the average of 3 and 4, or 3.5. Q1 is 1, Q3 is 7.
Comparing graphs
Points are plotted, box and whiskers drawn. Now we can compare the graphs and figure out which student is the most consistent. All three of these box-and-whisker plots are pretty similar, but they do have a couple of differences.The box part of the plot for student 2 is the shortest. This means that his data points are closer together; another way to say this is that student 2 has less variation in his data.
You may also notice that some of the critical values are different between the three plots. One critical point that varies the most between the three graphs is the median. Student 1 has a median of 4, student 2 has a median of 5, and student 3 has a median of 3.5. So even though student 1 and student 3 have the greatest maximums at 9, their medians are smaller than student 2.
Finally, the IQR values will show the teacher how consistent each student was. Student 1 has an IQR of 5, student 2 has an IQR of 4 and student 3's IQR is 6. So it's confirmed that student 2 is the most consistent. Before the teacher gets around to announcing the best student, the students clamor for him to show them how it's really done. Ahem. Deep in the mountains lies a martial arts school at 1/3 Foot Fist Way that focuses on breaking wooden planks, roads, trees, mountains.
Box-and-whisker plots exercise
-
Explain how to create a box-and-whisker plot.
HintsHere you see the list of scores of student one and the sorted version of this list below it.
Above both lists you can see the resulting box-and-whisker plot.
The median of a sorted list divides this list in two halfs with the same number of data points.
The interquartile range $IQR=Q_3-Q_1$ is a measure for variation.
SolutionHere you see a complete box-and-whisker plot.
How can we create such a plot? Well, for a given set of data, we first have to order the data points, namely the numbers.
Next we have to determine some critical values:
- The minimum
- The maximum
- The median
- The first quartile $Q_1$
- The third quartile $Q_3$
$1,~2,~2,~3,~4,~4,~6,~7,~8,~9$
The minimum of this list is the lowest or the most left value $1$, and the maximum the highest or the most right value $9$. We draw those values in a graph with a horizontal axis labeled from $1$ to $10$.
The median of an odd data list is the middle of the list. If the number of data points in the list is even, we choose the average of both middle data points. The list above has an even number of elements. So the median is the average of $4$ and $4$, which is $4$. We also draw this value in the graph above.
The first quartile is the median of the first half of the list. Here it's $2$. The third quartile is the median of the second half of the list, $7$. The interquartile range is given by $Q_3-Q_1=7-2=5$. We draw $Q_1$ as well as $Q_3$ in the graph above.
But we haven't finished yet:
- We still draw a box from $Q_1$ to $Q_3$.
- Last we connect the minimum, $Q_1$, $Q_3$, and the maximum with whiskers.
-
Find the right box-and-whisker plot.
HintsRemember to first order the list.
The minimum is the most left and the maximum the most right value of the ordered list.
The median of an even numbered list is the average of the two middle data points.
The median of an odd numbered list is the middle data point of the list.
However, the median divides the list in two lists of the same size.
$Q_1$ is the median of the first half and $Q_3$ is the median of the second half of a list of data.
SolutionTo create the box-and-whisker plot we want, we have to do the following:
- Sort the list: $1,1,2,3,5,5,6,6,8,8$.
- The minimum is $1$ and the maximum $8$ (the most left and most right values, respectively).
- The median is the average of $5$ and $5$, which is $5$. Here we have to determine the average of the two middle values because the number of elements in the list is even.
- The median of the first half of the list, $1,1,2,3,5$, is $Q_1=2$, and the median of the second half of the list, $5,6,6,8,8$, is $Q_3=6$.
- We draw a box from $Q_1$ to $Q_3$.
- Lastly we connect the minimum $1$ and $Q_1=2$ as well as $Q_3=6$ and the maximum $8$ with whiskers.
-
Compare the different data sets.
HintsThe interquartile range $IQR=Q_3-Q_1$ is a measure for variance.
The smaller the variance the higher the consistency.
The length of the box is the $IQR$.
SolutionLooking at the box-and-whisker plots for each student, we can compare the students to figure out which student is the most consistent.
The box of student $1$ is bigger than this one of student $2$. This is a measure for variation. Or, in other words, student $2$ is more consistent.
The minimum values are the same and the maximum of student $2$ is $1$ more than this one of student $1$.
Also the median of student $2$ is higher than this one of student $1$.
So we can conclude that, using the box-and-whisker plots, that student $2$ is the more consistent one.
-
Find the data set(s) corresponding to the box-and-whisker plot pictured.
HintsOrder each set so that you can find the critical values.
First check the minimum and maximum of the set.
Check each data set: it's possible that two different data sets lead to the same box-and-whisker plot.
SolutionFirst exclude any list with a either a minimum or maximum different than the minimum or maximum of the box-and-whisker plot pictured.
This means that we exclude the fourth list, as it does not have a minimum of $1$, and the first list, as it does not have a maximum of $6$.
Next let's have a look at the median: the median of the fourth list is $5$ and for all the remaining lists it's $4$.
So we calculate $Q_1$:
- $Q_1=2$ for the third list
- $Q_1=1$ for the last list
There are two lists left: calculating $Q_3$ for those lists, we get:
- The second list has the third quartile $Q_3=5$.
- The fifth list has the third quartile $Q_3=5$.
-
Label the values in a box-and-whisker plot.
HintsThe minimum is the lowest and the maximum the highest value of a data list.
The median lies in the middle of a sorted data list. It divides the list in two halfs of the same size.
The quartiles are the medians of the halves of a list:
$Q_1$ ($Q_3$) is the median of the first (second) half of the list.
minimum $\le$ $Q_1$ $\le$ median $\le$ $Q_3$ $\le$ maximum
SolutionHere you see the solution pictured.
The data list as well as the sorted data list is already given.
The minimum, $1$, is the most left and the maximum, $8$, the most right value.
The median lies in the middle of the list. The given list has an even number of entries, so the median is the average of the two middle data points, $4$ and $4$. Thus the median is $4$.
The quartiles are medians as well, each time for lists with an odd number of entries:
- $Q_1=2$ is the median of the first half $1,1,2,3,5$.
- $Q_3=2$ is the median of the second half $5,6,6,8,8$.
-
Determine the interquartile range $(IQR)$.
HintsThe interquartile range $IQR=Q_3-Q_1$ is a measure of variance for a data set.
First sort the list and determine the median.
If the list has an odd number of entries, then the median is the middle data point of the list.
If the list has an even number of entries, then the median is the average of both middle data points.
The first quartile $Q_1$ is the median of the first half of a data set and the third quartile $Q_3$ is the median of the second half of a data set.
The interquartile range can also be a rational number.
SolutionTo determine the interquartile range you first have to establish the first and the third quartile.
For this you need the median of the list.
The median of an odd numbered list is the middle data point of the list. If the list is even numbered the median is the average of both middle data points.
Let's start with $3,~3,~4,~7,~10,~11,~8,~2,~5,~4,~9$.
- The sorted list is $2,~3,~3,~4,~4,~5,~7,~8,~9,~10,~11$.
- The median is the middle of this list: $5$.
- The median of the first half $2,~3,~3,~4,~4$ is $Q_1=3$ and the median of the second half $7,~8,~9,~10,~11$ is $Q_3=9$.
- So $IQR=9-3=6$.
- The sorted list is $3,~3,~4,~4,~5,~7,~8,~12$.
- The median is the average of the two middle data points $4$ and $5$, namely $\frac{4+5}2=\frac92=4.5$.
- The median of the first half $3,~3,~4,~4$ is $Q_1=\frac{3+4}2=\frac72=3.5$ and the median of the second half $5,~7,~8,~12$ is $Q_3=\frac{7+8}2=\frac{15}2=7.5$.
- So $IQR=7.5-3.5=4$.
- The sorted list is $3,~5,~5,~5,~6,~7,~7,~8,~12$.
- The median is the middle of this list: $6$.
- The median of the first half $3,~5,~5,~5$ is $Q_1=5$ and the median of the second half $7,~7,~8,~12$ is $Q_3=\frac{7+8}2=\frac{15}2=7.5$.
- So $IQR=7.5-5=2.5$.


Cool video! Very informative!